Supply Chain & Sourcing Updates Q3 2026
Material Matters is Taylor’s quarterly research report analyzing supply chain conditions, sourcing trends and marketing pricing print, direct mail, packaging, and physical marketing materials.
Q3 2026 Sourcing and Supply Chain Report
Your research report covering sourcing trends, market pricing, supply chain conditions,
and category-specific updates across paper, label, packaging, promotional, logistics,
imports, regulatory/compliance, and color management.
Table of Contents
Market Overview
Q3 2026 Market Trends and Economic Indicators
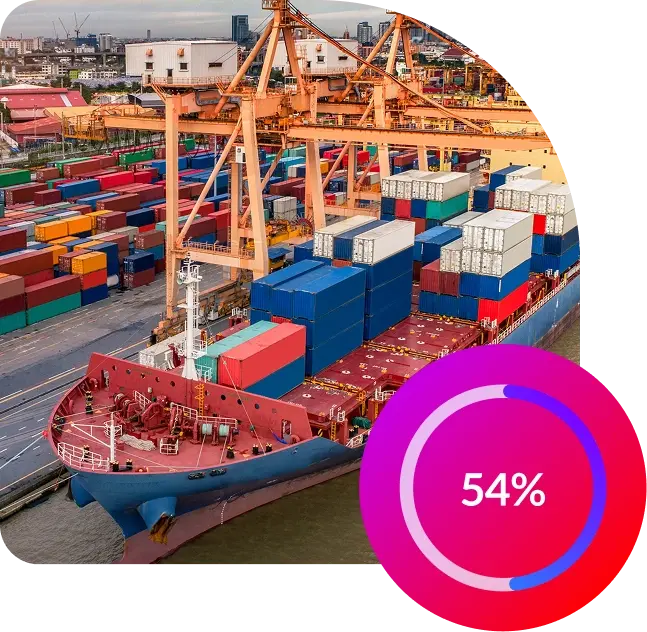
The ISM manufacturing PMI index registered 54% in May 2026, marking strongest U.S. factory growth in four years.
New orders, backlogs and production continued to grow, while raw materials and finished goods inventory contraction slowed. Price index decreased slightly (2.5%) in May versus April, but still remains high versus the previous year.
Consumer Spending/Sentiment
Consumer sentiment has rebounded significantly in Q2 2026 versus Q1 2026 as gasoline prices moderated. U.S. consumer spending has remained resilient, rising by 0.7% even with inflation increasing to an annual rate of 4.2%.
Commodity Pricing
Multiple commodities pricing increased in May, including metals, chemicals, plastics, paper, packaging, electronics, MRO supplies and energy inputs. Gasoline, diesel and crude oil continue to be at elevated levels due to the Middle East conflict.
Energy
WTI crude oil, U.S. diesel and gasoline prices have declined slightly from the significant spikes in Q2 due to the continued Middle East conflict. Fuel prices are expected to decrease in Q3 while domestic natural gas and consumer electricity rates are expected to increase.
Q3 2026 Inflation & Interest Rates
line with expectations as policymakers take a cautious approach, but if inflation continues to persist, then there is the possibility of an interest rate hike later in 2026.
Paper Market Overview
Q3 2026
continues to erode due to digital substitution, supply is contracting at a comparable pace,
resulting in tighter market conditions for certain paper grades.
In North America, uncoated freesheet and coated freesheet markets are seeing firmer pricing as mill closures, conversions, tariff pressure and lower imports reduce available supply.
North American coated freesheet prices rose in May, supported by tight supply-demand balance, strong operating rates, and logistics and energy cost pressure.
Paper Market Update
Demand
- Although demand for graphic papers, newsprint, and traditional printing and writing grades continues to decline structurally, the trend is not uniform across all end markets. Education, government, book publishing, direct mail and select specialty print applications continue to provide a stable demand base. As a result, the market is best characterized as a mature industry undergoing structural transformation, where long-term success depends more on operational efficiency, product diversification and strategic positioning than on volume growth.
Supply
- Supply constraints remain a key market driver. Producers in North America and Europe continue to close paper machines or convert capacity to packaging and specialty paper grades, reducing the availability of traditional graphic paper products. Industry consolidation and further diversification are expected to continue throughout 2026.
Pricing
- Earlier this year, there were uncoated freesheet price increases of roughly 5%–12% from several producers, tied to lower inventories, reduced imports and tighter mill order books.
Key Takeaway
- For buyers, market conditions are likely to remain tighter than demand trends alone would indicate. Despite declining consumption, ongoing capacity reductions, tariffs, transportation costs and a shrinking supplier base are sustaining pressure on both availability and pricing. Procurement strategies should emphasize supplier reliability, longer-term planning horizons, grade flexibility, and contingency sourcing options, particularly for coated freesheet, uncoated freesheet, newsprint and mechanical paper grades.
Uncoated Freesheet (UFS)
- UFS pricing is moving higher in 2026. Producers announced broad first-quarter increases, followed by a second wave entering mid-year. Reported increases include actions from Boise, Domtar, Sustana, Billerud, ND Paper, Sylvamo, Phoenix Paper, Finch, NORPAC and others, generally ranging from the mid-single digits to low double digits depending on grade, producer and timing.
- Allocation by some producers and reports of lead times extending into late summer or early fall indicate that availability is constrained, particularly for standard office, offset and book grades.
- The supply side is the main driver of current market tightness. Capacity has been reduced through permanent mill closures, machine conversions and producer exits from commodity printing grades.
- Pixelle’s Chillicothe mill closure removed a significant UFS supply source, while International Paper’s planned Riverdale machine conversion to containerboard is expected to further reduce UFS availability. Industry commentary points to UFS operating rates moving into the low-to-mid 90% range in 2026, which gives producers more pricing leverage and leaves less room for supply disruption.
Coated Freesheet (CFS)
- Supply is tightening because mills continue to rationalize graphic paper capacity and shift capital toward packaging, tissue and specialty grades. Coated freesheet capacity has been affected by producer discipline, machine closures and consolidation across the broader graphic paper sector.
- In Europe, the proposed UPM and Sappi graphic paper joint venture signals continued capacity rationalization and portfolio optimization, while North American buyers remain exposed to a smaller supplier base and fewer import alternatives.
- Coated freesheet pricing is moving higher in 2026. Sheridan reported that North American CFS prices rose about $20 per ton in May as second-quarter increases gained traction, with additional gains expected to materialize by mid-summer.
- Earlier second-quarter announcements included increases from Sappi, Billerud, ND Paper and several offshore suppliers, generally tied to higher energy, pulp, logistics, freight and operating costs.
- The key point for buyers is that producers are succeeding in pushing through price recovery despite soft long-term demand because the available supply base is tighter and cost inflation remains elevated.
Label Market Overview
Q3 2026
Throughout Q2, higher prices for label raw materials were applied across the full value chain,
with a portion of those increases extending into Q3 2026.
Major label material suppliers, along with their upstream sources and downstream label converters, remain under pressure from cost drivers that include petroleum/fuel, chemicals, adhesives, paper, plastics and other manufacturing inputs affected by the Middle East conflict.
Paper Facestocks and Liners
- Paper label facestock and liner material pricing continued to increase in Q2 and is expected to have negative impact in Q3 2026. As previously reported, paper mills are moving toward higher-value products and consolidating. Although paper facestock supply is relatively stable, there are signs that certain types of liner product supply is tightening and/or longer lead times are being implemented.

Films and Adhesives
- BOPP, PE, and PET film market prices have risen sharply (30%-50%)over the past two-(2) quarters as petroleum-based products continue to be negatively impacted by the Middle East conflict. We do expect to see some stabilization in Q3 2026 within the CDI index adjustments.
- Acrylic and hot-melt adhesive demand remains strong with stable supply into Q3. Raw material input costs for adhesives continue to increase due to global petroleum price volatility. Overall filmic supply remains sufficient for NA and global demand.
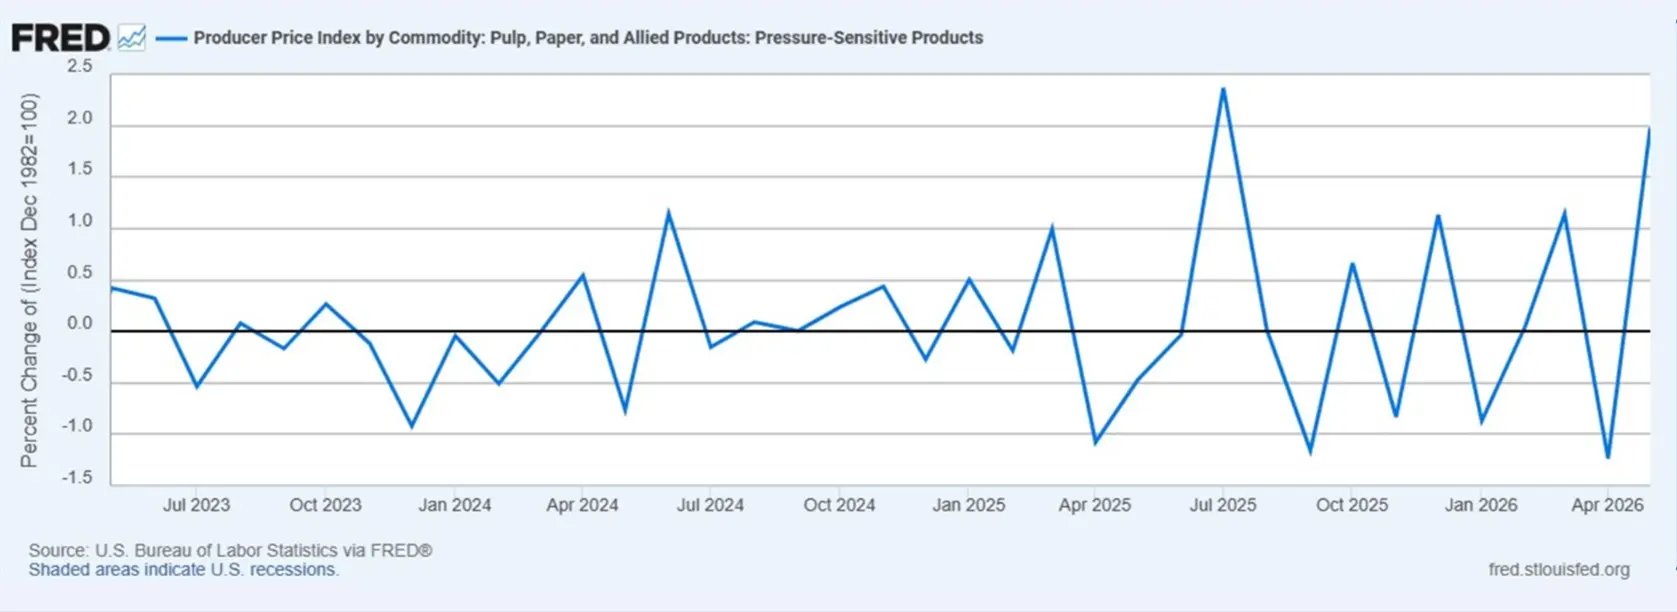
Labels PPI
The graph below details the Producer Price Index (PPI) for raw label pressure-sensitive materials from May 2023 through May 2026.
NOTE: New quarterly data not available until mid-to-late July 2026.
Packaging Market Overview
Q3 2026
The packaging market remains unstable, driven by tariffs, industry
consolidation and the conflict in the Middle East.
Aluminum & Tooling/Die Categories
- Aluminum pricing increased in February 2026 with tariffs continuing to pressure the market. Aluminum costs are having the greatest impact on CTP equipment.
- Processless plates continue to be a rising trend in the overall plate-making market.
- Demand for aluminum plates is growing moderately and is expected to continue into 2027.
- Tooling and die markets have implemented price increases and tariff surcharges driven by higher material costs and trade policy changes.

Corrugated & General Packaging Supplies Update
- Multiple market price increases of $30/ton and $50/ton went into effect in Q2 2026.
- Increasing fuel costs are creating additional instability in the corrugated packaging market.
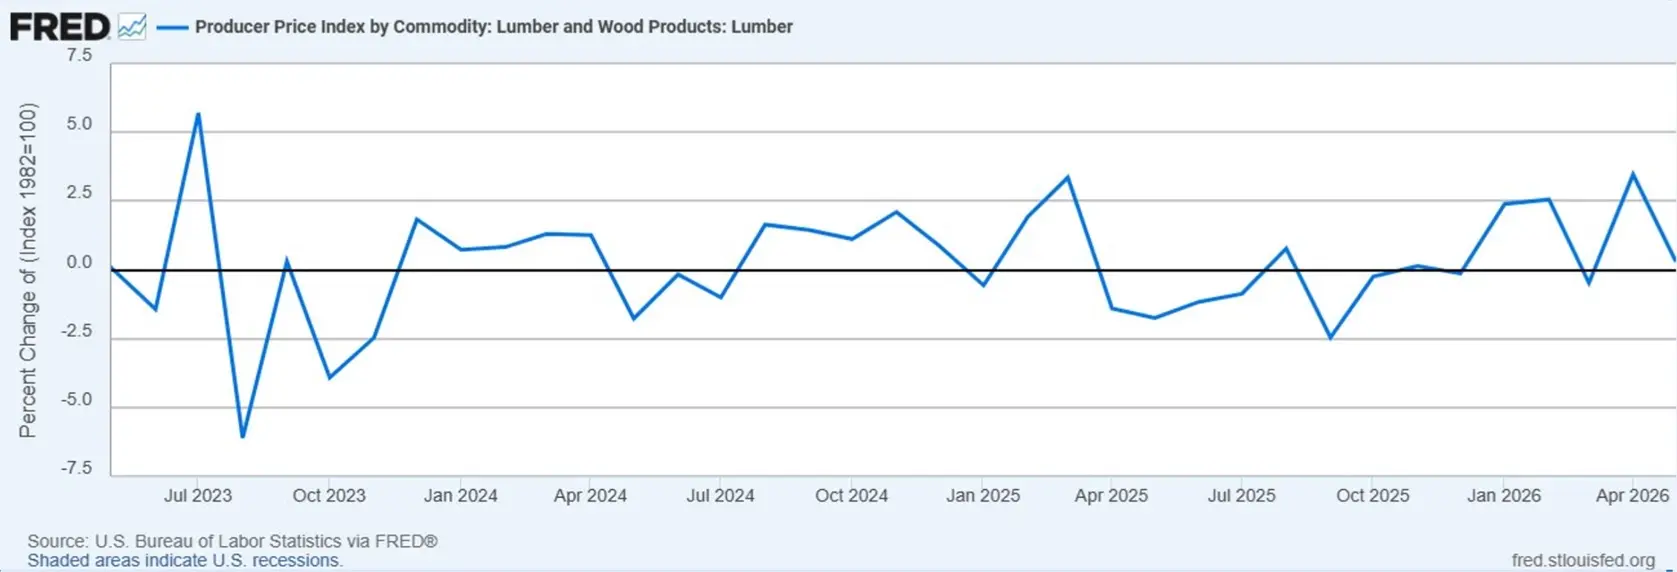
Wood Pricing
- Overall market has seen price increases driven by freight costs and overall lumber increases. The market demand has normalized in the past couple of months.
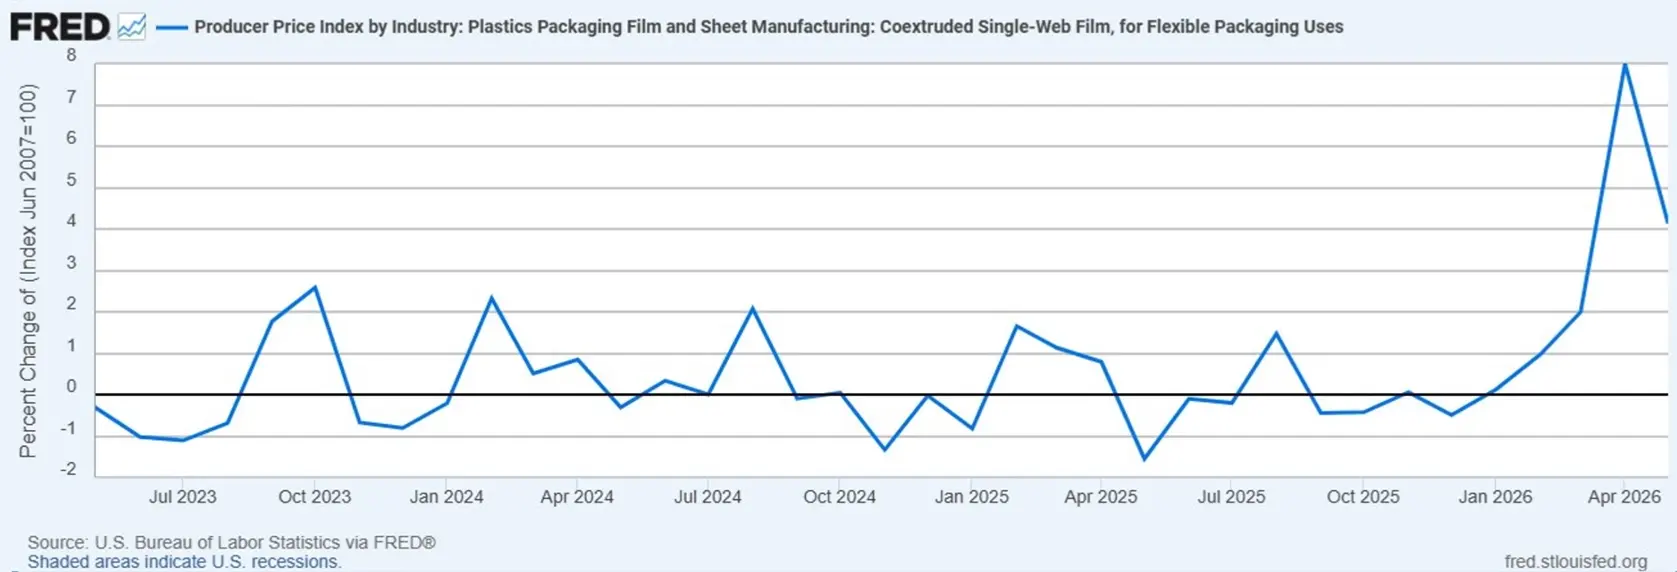
PPI: Flexible Packaging Film
The graph below details the Producer Price Index (PPI) pricing for flexible packaging film from May 2023 through May 2026.
NOTE: New quarterly data not available until mid-to-late July 2026.
PPI: Lumber and Wood Products
The graph below details the Producer Price Index (PPI) pricing for lumber and wood products from May 2023 through May 2026.
NOTE: New quarterly data not available until mid-to-late July 2026.
Promotional Market Overview
Q3 2026
As the second half of 2026 begins, the promotional products industry enters a period of
resilience through transition, including navigating a tariff regime change, persistent
geopolitical volatility and disciplined, diversified growth across Q3 and Q4.
The Key Forces Shaping Q3 2026
Tariff Transition & Refund Recovery
- IEEPA tariffs struck down; Section 122’s 10% baseline expires July 24, 2026
- New Section 301 duties (10%–12.5% on ~60 nations) and Section 232 metals tariffs step in
- $166B+ in refunds flowing via the CAPE portal, but claims are complex and importer-only
Resilience Amid Geopolitical Turbulence
- Strait of Hormuz disruption is now the operating norm, keeping fuel and freight volatile losses.
- Carriers adapt through rerouting, transshipment and surcharges; key lane rates up ~40%.
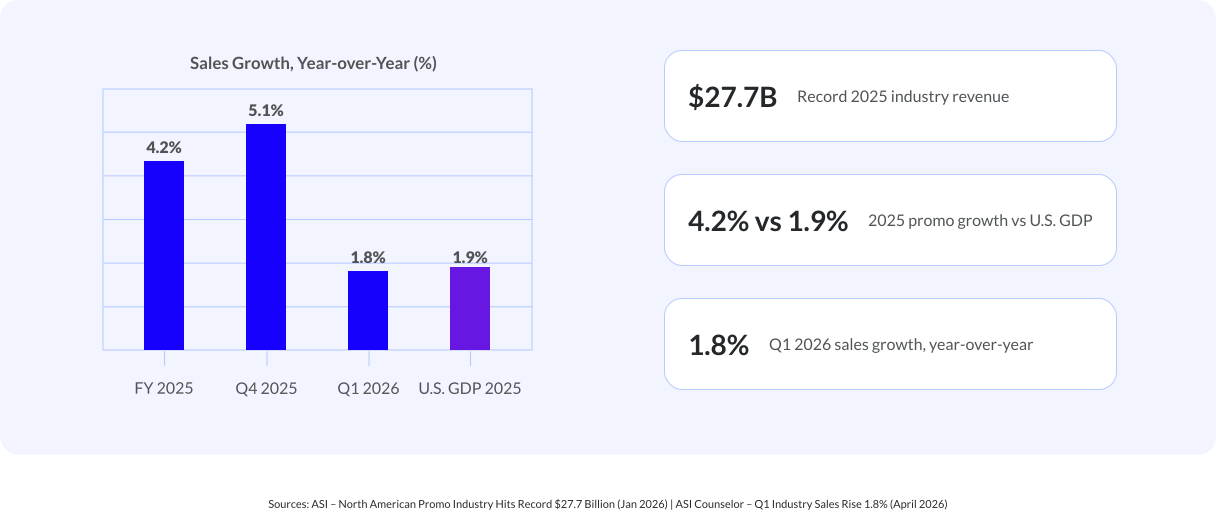
- Promo outpaced the U.S. economy in 2025 (4.2% vs 1.9% GDP), underscoring its resilience.
Growth Drivers & Pricing Discipline
- Q1 2026 sales rose 1.8% YoY; modest full-year growth expected off a record $27.7B in 2025.
- Diversification, AI investment, client relationships and Made-in-USA lines drive gains.
- Prices stay elevated on China for sourced tech and drinkware; buyers trim quantity, not quality.
Sources: PPAI Research – The Tariff Effects, From Refunds To End Buyers (June 2026) | ASI Counselor – Everything You Need To Know About Tariff Refunds (June 2026) | ASI – North American
Promo Industry Hits Record $27.7 Billion
Half-Year Growth in Focus
Promo closed 2025 at a record $27.7 billion, growing 4.2% and outpacing the broader U.S. economy, but momentum cooled
entering 2026 as tariffs and geopolitical costs weighed on demand.
Logistics Market Overview
Q3 2026
rates and capacity constraints as in Q2 2026.
Truckload capacity continuing to tighten due to carrier exits, driver shortages and regulatory pressures. Spot and contract truckload rates are increasing and are expected to remain elevated through the remainder of 2026. LTL carriers remain disciplined on pricing, with little indication of rate relief despite soft freight volumes.
International logistics remains heavily influenced by Middle East disruptions, fuel volatility, tariff uncertainty and ongoing Red Sea routing changes. Supply chain resilience, carrier diversification and procurement flexibility remain critical strategies for shippers.
Small Package Outlook: Carrier Market Strategies
-
USPS
USPS enters Q3 2026 amid significant transformation, continued financial pressure and another round of rate increases. The organization remains committed to its Delivering for America (DFA) modernization strategy, focused on expanding package revenue, modernizing the network and improving long-term financial sustainability. -
FedEx
FedEx enters Q3 2026 with positive momentum following strong fiscal year-end results, continued parcel volume growth and the successful spin-off of FedEx Freight. Pricing discipline remains a core strategy, with FedEx maintaining 2026 GRIs, tightening discount structures and increasing focus on yield management rather than market share growth. -
UPS
UPS enters Q3 2026 focused on its long-term" Better, Not Bigger" strategy, emphasizing profitability, network efficiency and higher-quality freight rather than pursuing shipment volume growth. This aligns with the parcel industry's broader shift toward yield management, disciplined pricing and selective customer acquisition. -
Amazon.com Services
Amazon continues transforming from an e-commerce retailer into a fully integrated logistics provider. The company is simultaneously opening its logistics network to non-Amazon businesses, expanding rural delivery coverage, increasing automation and regionalized fulfillment, growing freight offerings and reducing dependence on traditional parcel carriers.
Less-Than-Truckload Logistics Market Overview
The North American LTL market enters Q3 2026 in a stronger position than it has been for several years. While freight demand is improving, the primary driver of market conditions remains supply-side discipline rather than a surge in shipment volumes. Carriers continue to benefit from the structural changes created by the 2023 Yellow Freight company shutdown, tighter network control and a willingness to prioritize yield over market share.
Unlike prior cycles, carriers have largely resisted aggressive discounting despite soft-to-
moderate freight demand. Most major LTL providers continue to implement general rate increases (GRIs), stronger accessorial programs and tighter freight qualification standards.
Capacity & Demand
-
Manufacturing activity has improved during 2026, supporting modest increases in industrial freight
volumes. -
Cross-border freight with Mexico remains a key source of growth.
-
Some freight is shifting back into LTL networks as truckload rates rise.
- Demand is improving but remains below historical expansion-cycle levels.
- Carriers continue expanding selectively through terminal additions, equipment purchases and
network optimization.
Carrier Pricing Strategies
-
Major carriers continue to prioritize:
-
Margin protection
-
Yield management
-
Freight quality
-
Network optimization rather than pursuing shipment growth through price concessions
-
-
GRIs generally remain in the 5%–7% range.
-
Contract renewals continue to support low-to-mid single-digit increases.
-
Accessorial charges are becoming a larger contributor to total landed cost.
-
Fuel surcharge volatility remains an additional risk factor.
Outlook
-
Manufacturing recovery and cross-border growth are providing modest demand improvement.
-
Capacity remains available but increasingly selective due to carrier network discipline.
-
LTL carriers continue prioritizing yield and profitability over shipment growth.
-
GRIs and accessorial increases are keeping transportation costs elevated.
-
Yellow Freight-related capacity reductions continue to influence the market.
-
No significant rate relief expected through 2026.
-
Carriers remain focused on technology, network optimization and operational efficiency.
Truckload Logistics (TL) Market Overview
The North American LTL market has entered a period of controlled recovery. Freight demand remains below historical peaks, but carriers are maintaining strong pricing leverage through network discipline, capacity management and selective customer acquisition strategies.
Unlike previous cycles, carriers are prioritizing profitability and yield rather than aggressively pursuing shipment growth.
Capacity & Demand
- Industrial manufacturing activity is improving modestly, supporting palletized freight demand.
- Nearshoring and Mexico-U.S. trade continue generating cross-border LTL opportunities.
- Inventory levels remain relatively lean, resulting in smaller and more frequent shipments.
- Some truckload freight is migrating into LTL as truckload rates increase and capacity tightens.
- Capacity is available but increasingly selective.
- Investments in terminals, fleet modernization and network optimization continue among major carriers.
Carrier Pricing Strategies
- TL providers are regaining pricing leverage.
- Spot market TL Rates are up approximately 24% YOY.
- Seasonal peaks are expected to push rates to multi-year highs during Summer 2026.
- Mid-year rebids increasing.
- Increased focus on freight density and profitability.
- Reduced willingness to accept aggressive rate reductions.
Outlook
- Manufacturing recovery and cross-border growth are providing modest demand improvement.
- Capacity remains available but increasingly selective due to carrier network discipline.
- LTL carriers continue prioritizing yield and profitability over shipment growth.
- GRIs and accessorial increases are keeping transportation costs elevated.
- Yellow Freight-related capacity reductions continue to influence the market.
- No significant rate relief expected through 2026.
- Carriers remain focused on technology, network optimization and operational efficiency.
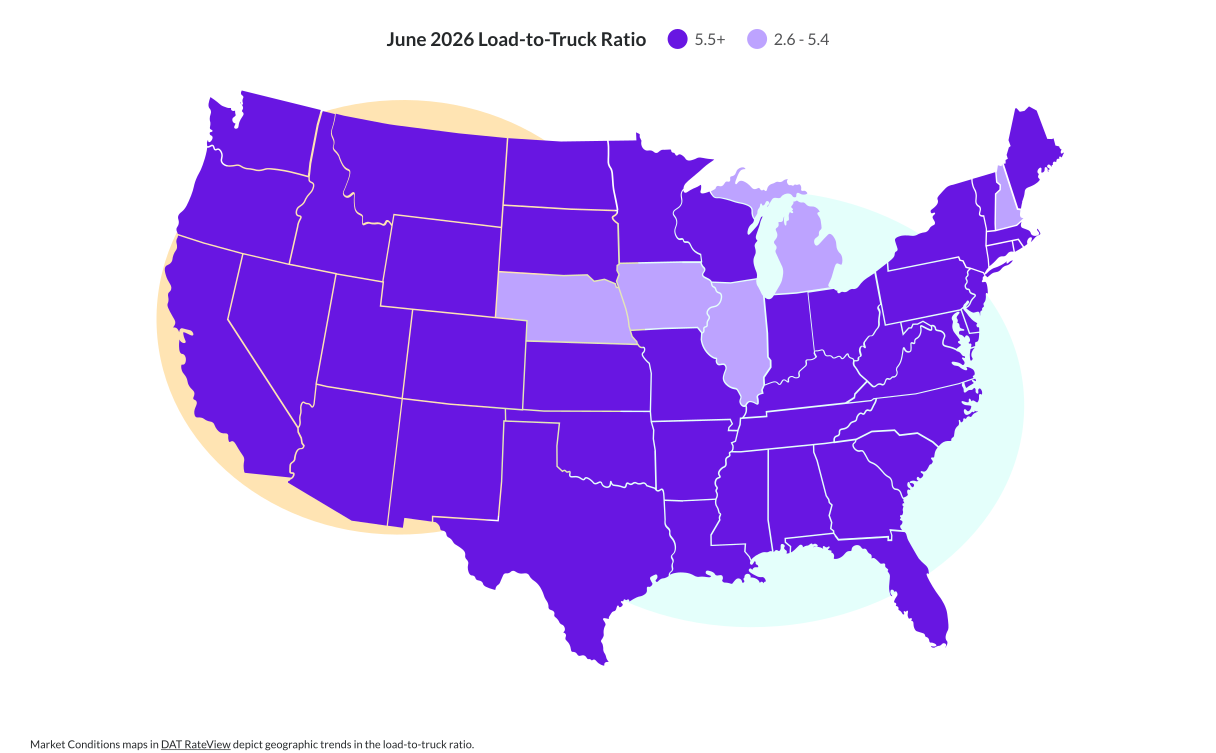
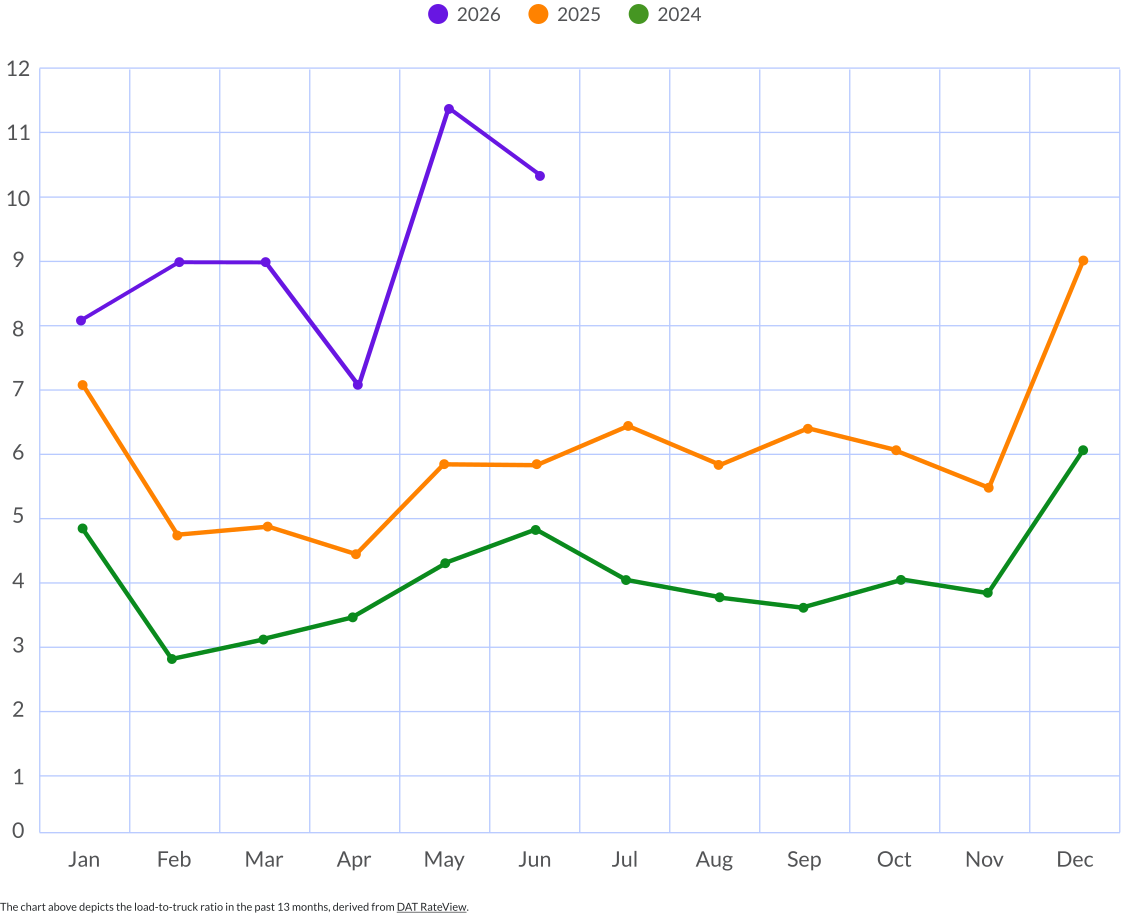
Van Demand & Capacity
Van Load-to-Truck Ratio
International Logistics Market Overview for
Q3 2026
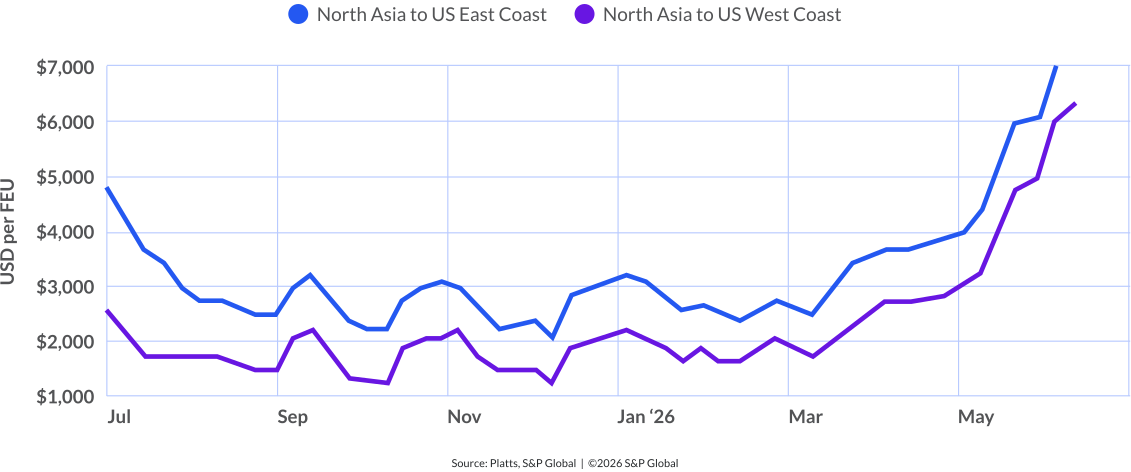
International supply chains have largely adapted to disruptions; however, costs, routing complexity and geopolitical risks remain elevated. Shippers should expect continued volatility rather than a return to pre-2020 supply chain conditions.
Key risk areas include the Middle East, Red Sea shipping lanes, tariff policy changes, air freight rerouting and fuel costs.
Ocean Freight
-
Global container capacity remains abundant due to significant vessel deliveries entering the market during 2025-2026.
-
Despite fleet growth, effective capacity remains constrained by route diversions, network adjustments and lingering operational disruptions.
-
Freight rates remain highly sensitive to developments in the Red Sea and Suez Canal. A broader return to these routes could place downward pressure on rates later in 2026.
Air Freight
- Air cargo continues outperforming broader trade growth, supported by:
- Asia-Pacific exports.
- High-value technology shipments.
- Supply chain diversification efforts.
- Global demand continues to exceed capacity growth in several trade shipping lanes.
- Middle East airspace disruptions have reduced capacity on key logistics routes in the region.
- Elevated fuel costs continue supporting higher freight yields.
Outlook
-
Trade policy volatility remains the primary wildcard in Q3 2026.
-
Continued reassessment of global sourcing strategies.
-
Expansion of "China+1" sourcing models.
-
Growth of manufacturing in Vietnam, India, Mexico and Southeast Asia.
-
Ongoing tariff adjustments complicating landed-cost forecasting.
International Logistics Market Rate Per Full Container Unit
International (Imports) Market Overview
Q3 2026
Fall Season Importing
US imports from Asia in May jumped to 1.68 million TEUs, up 13% from April, almost 20% higher year over year, and the highest since last August, according to PIERS (an import/export database).
The National Retail Federation (NRF) has upgraded its forecast for June imports, confirming peak season has come early this year. NRF expects it to be lower through the rest of the summer into early fall.
Source: Journal of Commerce
United States-Mexico-Canada Trade Agreement (USMCA)
The U.S., Mexico, and Canada held a mandatory joint review of USMCA on July 1, 2026, as required under the Agreement.
- The USMCA is terminated on July 1st, 2035, unless all parties confirm agreement to continue in its current form.
- The U.S. did not agree to renew USMCA in its current form; US Trade Representative Jamieson Greer confirmed the agreement “is not renewed.”
- Since US declined to renew in its current form, there will be a third round of bilateral negotiations with Mexico in the week of July 20th.
- USMCA remains legally in force pending resolution of outstanding issues or eventual termination.
- Washington will hold a third round of bilateral negotiations with Mexico the week of July 20.
- What this signifies : From 2027-2036, USMCA will be reviewed annually.
- Source: Ambassador Greer Issues Statement on the USMCA Joint Review | United States Trade Representative
State of IEEPA Tariff Refunds
State of Refund Issues
The Court of International Trade (CIT) has ordered the US Customs and Border Protection (CBP) to refund tariff duties. CBP launched its refund platform called Consolidated Administration and Processing Entries (CAPE). It operates inside the Automated Commercial Environment (ACE) to allow importers with current access to process refunds within the same access.
Phase One and Phase Two
Phase One was initiated in April 2026. All unliquidated entries were eligible for this first phase minus reconciliation or flagged entries.
Phase Two effective June 29th by accepting entries flagged or reconciliation entries. These entries will be limited to unliquidated entries or those within 80 days of liquidation.
State of Remaining Entries
Future phases will deal with liquidated entries. No dates provided yet when this will commence.
State of Tariffs
Section 122 global tariff rate of 10% is set to expire on July 24th
Following the Supreme Court’s March decision to strike down President Donald Trump’s widespread tariffs implemented in April 2025, the US Trade Representative imposed temporary Section 122 tariffs on all imports. Section 122 global tariff of 10% is set to expire on July 8th causing a new round of tariff uncertainty.
Section 301 tariff is Here to Stay
On June 15, 2026, the U.S. Supreme Court declined to hear an appeal challenging the legality of Section 301 tariffs on Chinese imports. This means that all Section 301 tariffs are now legal and here to stay. US Customs Border and Protection is expected to increase scrutiny of classification and valuation practices.
Forced Labor enforcement related to Section 301
US is proposing 10-12.5% tariffs on 60 economies following Section 301 investigations on steps taken to prohibit forced labor.
Source: USTR Report Sec 301 FL 301 6-2-26
Compliance/Regulatory
Market Overview
Q2 2026 was a transition quarter from watch and prepare to document and operationalize.
Several regulatory programs moved into near-term reporting, registration, data-collection
or enforcement-readiness phases
Areas most relevant to Taylor's Product mix:
-
CPSC e-filing
-
Packaging EPR
-
PFAS reporting
-
FDA food traceability/chemical review
-
EU PPWR packaging obligations
e-filing – US Consumer Product Safety Commission (CPSC)
Beginning July 8, 2026, importers must e-file Certificate of Compliance data for covered products at the time of entry into the United States. This rule requires certificate data to be submitted to U.S. Customs and Border Protection (CBP) at the time of entry, giving the CPSC visibility into product compliance information.
What is the impact?
- Primarily impacts facilities importing products subject to U.S. Consumer Product Safety Commission (CPSC) regulations, including children's products and general-use products with applicable safety rules.
- Creates a new operational requirement tied directly to import activity and reinforces the need for strong upstream controls over new vendor requests, product classification, third-party testing, certification records, supplier documentation and entry data readiness.
Extended Producer Responsibility (EPR)
Extended Producer Responsibility (EPR) is a policy approach to make producers responsible for the management of environmental impacts of their products and packaging. Currently, townships, cities, counties and other municipalities, as well as consumers, are primarily responsible for the end-of-life. The idea behind EPR is that some or all of this responsibility shifts to producers.
EPR Covered Products
- All Packaging Types: Material, substance, or object that is used to protect, contain, transport, serve or facilitate delivery of a product.
- Paper Products: Paper sold or supplied to a consumer for personal, noncommercial use, including flyers, brochures, booklets, catalogs, magazines, printed paper and all other paper materials.
- Beverage Containers: Any container in which a producer originally prepackaged and sealed a beverage that is a drinkable liquid intended for human oral consumption.
Does EPR impact Taylor business units?
Yes, EPR regulations will apply to Taylor business units in some way. To determine applicability, each Taylor business unit will need to understand and determine the following:
- Do you manufacture or distribute covered products that contain covered materials, and are they received by covered entities?
- Are you the producer?
- If you are the producer, are covered entities who receive your covered products located in the State of California, Colorado, Connecticut, Maine, Maryland, Minnesota or Washington?