Supply Chain & Sourcing Updates Q4 2026
Material Matters is Taylor’s quarterly research report analyzing supply chain conditions, sourcing trends and marketing pricing for print, direct mail, packaging and physical marketing materials.
Q4 2026 Sourcing and
Supply Chain Report
Your research report covering sourcing trends, market pricing, supply chain conditions,
and category-specific updates across paper, label, packaging, promotional, logistics,
imports, regulatory and compliance, and color management.
Table of Contents
Market Overview for Q4 2026
Q4 2026 Market Trends and Economic Indicators
While concerns about higher inflation rates remain, the U.S. economy continued to grow for the 23rd straight month.
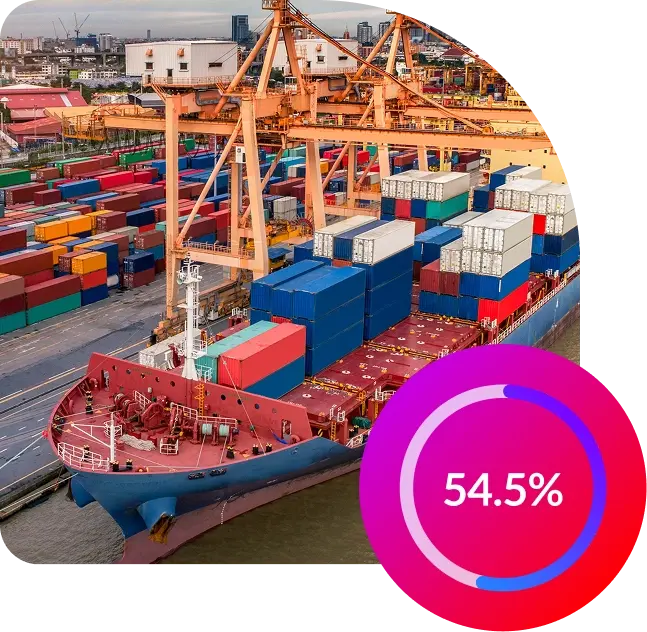
The ISM manufacturing PMI index registered at 54.5% in September 2026.
CPI (Consumer Price Index) is expected to finish at 3.6% going into Q4 of 2026.
The Federal Reserve implemented a slight rate increase (0.25%) in September 2026.
Manufacturing Momentum & Rising Costs
New orders, backlogs, production and employment continued to grow in September, while raw materials and finished goods inventory contraction slowed.
Raw material prices rose sharply in September with metals, petroleum, transportation and machinery. Price increases have been driven largely by ongoing geopolitical tensions and the conflict in the Middle East.
Higher Inflation & Interest Rate Increases
Some analysts expect CPI to remain steady between 3.4% to 3.7% over Q4 2026 due to persistent energy price pressures linked to Middle East geopolitical conflicts.
The Federal Reserve is expected to remain cautious with most analysts expecting at least one more interest rate hike in Q4 2026.
Energy Watch: Crude, Diesel & Gasoline
WTI crude, U.S. diesel and gasoline have eased slightly toward the end of September 2026.
Analysts expect the same into Q4 2026 due to U.S. strategic reserve releases.
If the Middle East conflict continues without a resolution, energy prices may remain high.
Consumer Spending & Commodity Pricing
-
Q4 Consumer Spending & Sentiment
Consumer sentiment is hovering at multi-year lows, but actual nominal retail spending remains resilient.
Even with higher inflation, higher fuel prices and labor market concerns, the upcoming holiday retail sales are expected to surpass a historic $1 trillion in consumer spending.
Consumers are expected to leverage AI tools to "aggressively" find deals ahead of holidays. -
Commodity Pricing in Q4
Multiple commodities including metals, chemicals, plastics, paper, packaging, electronics, MRO supplies and energy inputs all saw significant price increases in Q3 2026, which are expected to carry into Q4 2026.
Paper Market Overview
Q4 2026
continues to erode due to digital substitution, supply is contracting at a comparable pace,
resulting in tighter market conditions for certain paper grades.
Paper Market Update
Demand
- Demand for graphic papers, newsprint, and traditional printing and writing grades keeps declining structurally — but not uniformly. Education, government, book publishing, direct mail and select specialty print applications provide a stable base.
Supply
- Supply constraints remain a key market driver. Producers in North America and Europe continue closing paper machines or converting capacity to packaging and specialty grades, reducing availability of traditional graphic paper.
Pricing
- North America is seeing firmer pricing on uncoated and coated freesheet as mill closures, conversions, tariff pressure and lower imports reduce available supply. Earlier-year UFS increases ranged roughly 5%–12%. Fuel surcharges have started from both paper mills and paper merchants.
Key Takeaway
- Market conditions are likely to stay tighter than demand trends alone suggest. Procurement should emphasize supplier reliability, longer-term planning, grade flexibility and contingency sourcing — especially for coated/uncoated freesheet, newsprint and mechanical grades.
Uncoated Freesheet (UFS)
The market is tight and prices are rising, even though underlying demand remains weak. Capacity reductions and lower import availability have tightened supply faster than consumption has declined.
- Demand remains structurally soft. UFS demand was down about 5.6% year to date through May, and U.S. UFS shipments were down 9% through June. Total printing-and-writing shipments fell another 7% YOY in August.
Sources: Sheridan July 2026 Market Update | AF&PA June 2026 Market Update | AF&PA August 2026 Market Update - Supply is contracting faster than demand. North American UFS capacity is projected to decline by roughly 366,000 tons in 2026, versus an estimated demand decline of about 223,000 tons. Key drivers include permanent mill closures, machine conversions to packaging grades, maintenance outages, and operating disruptions.
- Pricing has firmed substantially. Published market reporting indicates UFS prices increased approximately $120 per ton during the first half of 2026, leaving prices about 7% above the prior year. Producers announced multiple increases ranging generally from 4% to 8%, with some product-specific announcements higher.
- Operating rates are elevated. Remaining North American capacity is expected to operate in approximately the low-90% range, which limits producers’ ability to absorb unexpected outages or short-term demand spikes. Boise, Sylvamo, and some other producers have used allocation or controlled-order systems during 2026.
Source: SPC
Coated Freesheet (CFS)
The coated freesheet market is relatively balanced, but pricing remains firm despite declining demand. Capacity reductions, production downtime, rising costs, and trade uncertainty are offsetting weakness in commercial print, catalogs, and publishing.
- Demand remains soft. Coated grades experienced steeper first-quarter declines than uncoated freesheet, reflecting continued weakness in advertising, catalogs, and premium print. July CFS shipments declined approximately 6% YOY, although this was the strongest performance among the major printing-and-writing.
Source: AF&PA - Imports are critical to supply. Imported CFS represents roughly one-third of North American consumption. CFS net imports increased 51% YOY in July, providing supply relief but also increasing buyer exposure to tariffs, freight costs, currency movements and international lead times.
Sources: AF&PA August 2026 Market Update | Sheridan September 2026 Market Update - Prices increased during the second quarter. Sappi implemented a 6% increase, while Billerud, ND Paper, UPM, Burgo, Lecta, Suzano and other suppliers announced increases generally ranging from 5% to 10%. The increases were driven primarily by pulp, energy, freight, and operating costs — not by demand growth.
Source: Sheridan - Availability has tightened selectively. More than 300,000 tons of North American coated-paper capacity has reportedly been removed since 2021. Remaining producers have been operating around the low-90% range, supporting pricing discipline while leaving the market sensitive to outages and maintenance downtime.
Source: SPC - Fourth-quarter conditions appear stable but uncertain. Prices were holding firm through August. Planned mill outages and U.S.–Canada trade actions could disrupt normal flows, particularly because CFS depends heavily on imported supply.
Source: Sheridan
Label Market Overview
Q4 2026
Major label material suppliers, along with their upstream sources and downstream label converters, remain
under pressure from cost drivers that include petroleum/fuel, chemicals, adhesives, paper, plastics and
other manufacturing inputs affected by the Middle East conflict.
Paper Facestocks and Liners
- Paper label facestock and liner material pricing remained stable in Q3 2026 after multiple increases in Q1 and Q2 2026. Q4 2026 will see pressure from upstream paper mills primarily driven by industry consolidation and rising input manufacturing costs. Supply remains stable across most products.
Films & Adhesives
- BOPP, PE and PET film supply and demand is expected to be stable going into Q4 2026. Significant inflationary price pressures in first three quarters of 2026 seem to have settled a bit going into Q4 2026. If the Middle East conflict continues, film products will see additional price increases despite sufficient supply.
- The North American adhesives market will continue to see elevated pricing primarily due to continued increases in raw feedstock, acrylic monomer and tackifier costs. Adhesives raw material supply chains are directly impacted by crude-oil volatility, which means the Middle East conflict will play a significant part in supply and pricing heading into Q4 2026.
PPI: Raw Label Pressure-Sensitive Materials
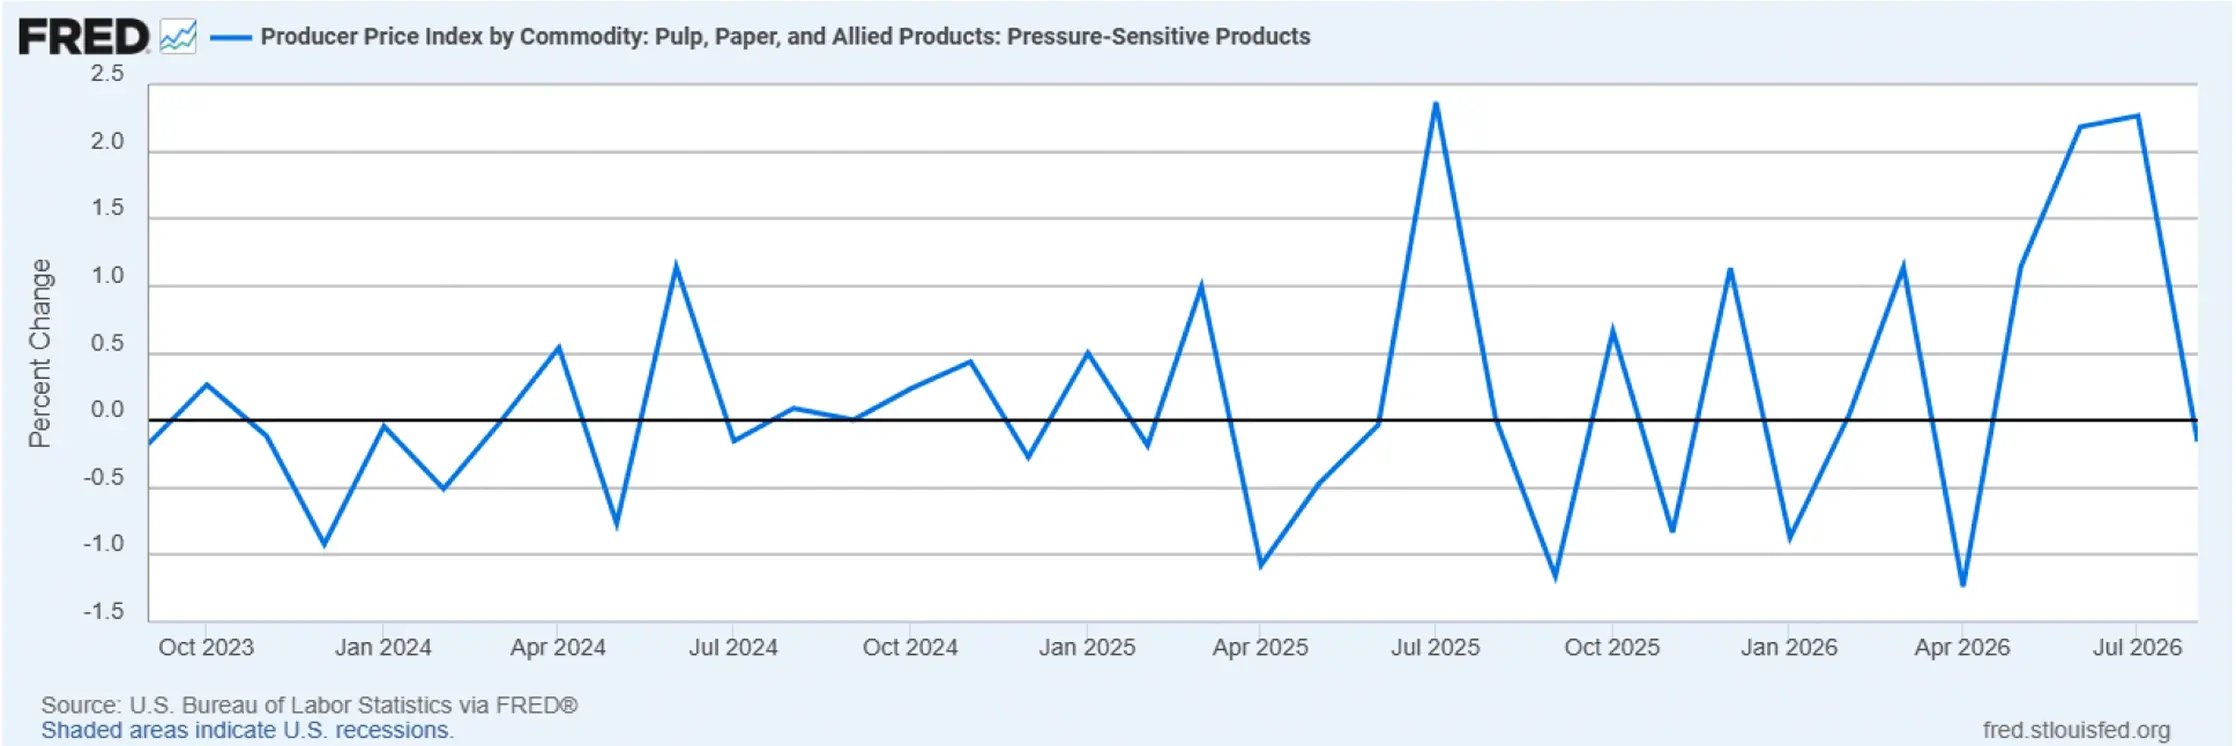
This graph details the Producer Price Index (PPI) for raw label pressure-sensitive materials September 2023 through August 2026.
NOTE: New quarterly data not available until mid-to-late October 2026.
Packaging Market Overview
Q4 2026
The packaging market remains unstable, driven by tariffs, industry
consolidation and the conflict in the Middle East.
Aluminum & Tooling/Die Categories
Aluminum pricing increased in Q3. Supply remains stable, but market conditions continue to be monitored.
A price increase is expected for tooling/die in early 2027, but there are no immediate supply chain concerns at this time as Q4 begins.
Key drivers for the increase:
- Tariffs
- Increased transportation costs
- Regional premiums remain elevated from suppliers

Corrugated & General Packaging Supplies Update
Market price increases continued with a $70/ton increase in Q3 2026. There is still expected volatility in the corrugated and packaging markets heading into Q4.
Key drivers for the increase:
- Increased transportation costs
- High manufacturing costs (e.g., raw materials, labor, energy)
Wood Packaging Pricing
The overall market is looking to remain generally stable in Q4 2026, though new lumber products continue to have higher costs.
The used lumber market for Grade A and B pallet pricing remains stable, and should continue to be for the remainder of the year.
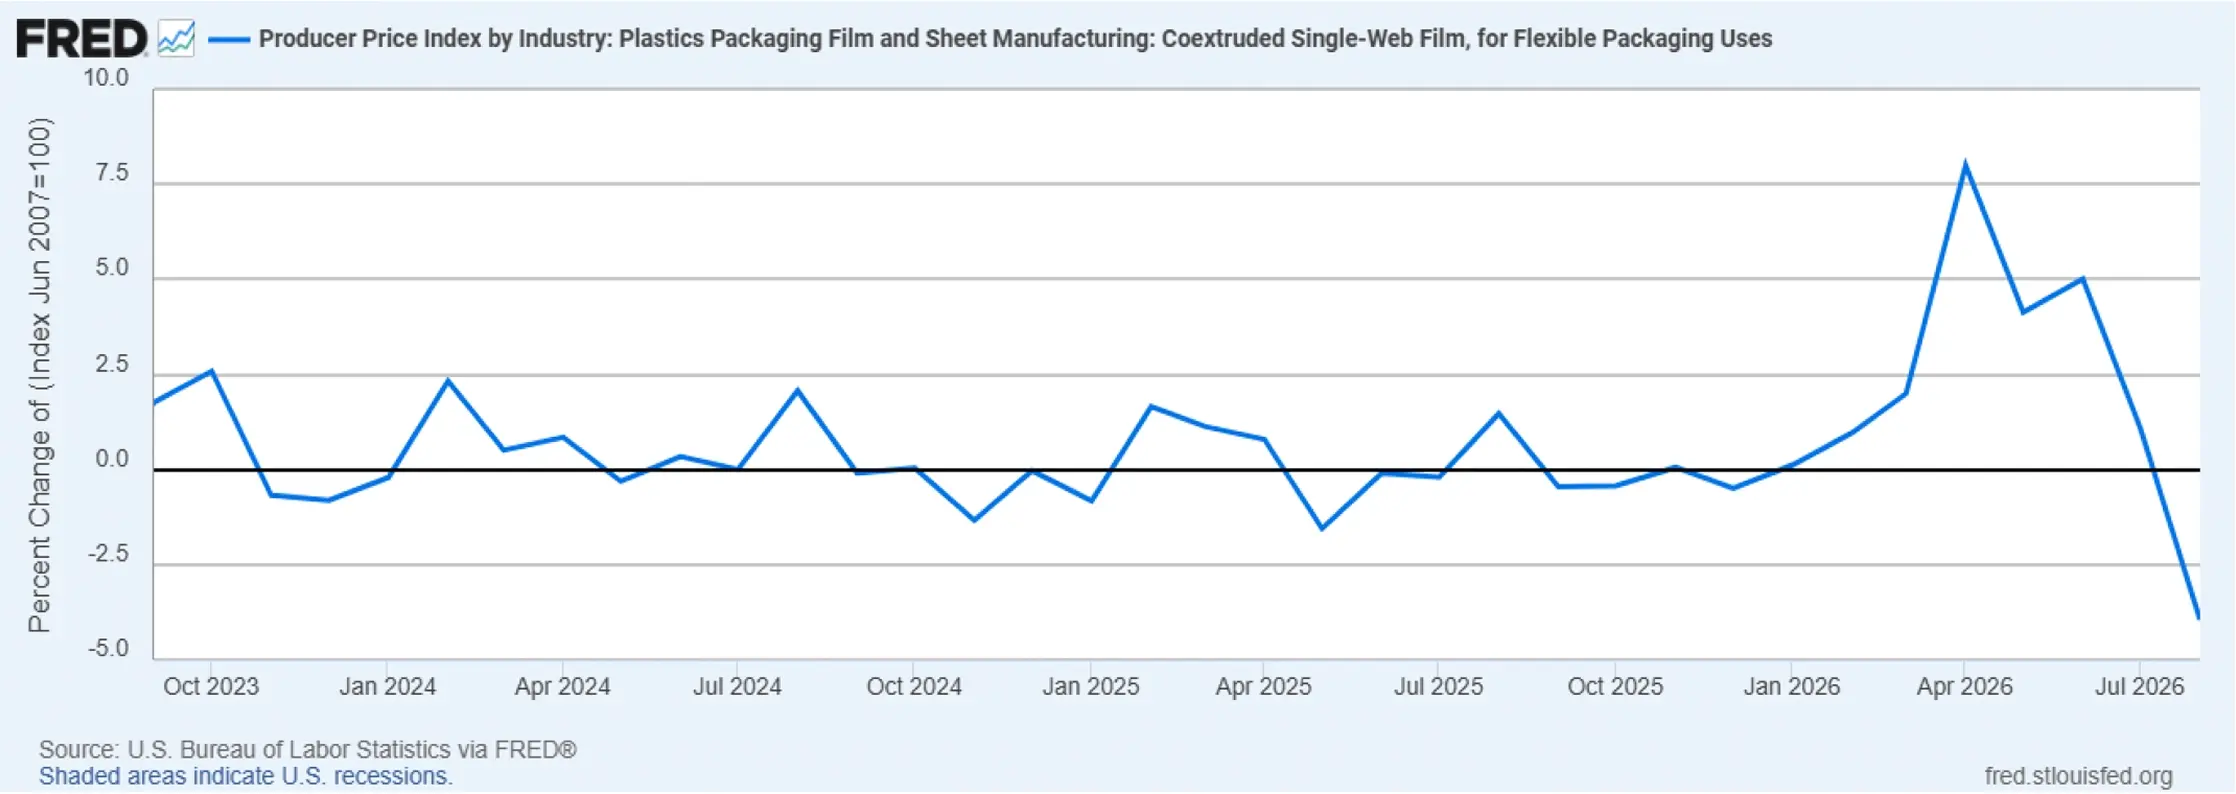
PPI: Flexible Packaging Film
The graph below details the Producer Price Index (PPI) pricing for flexible packaging film from September 2023 through August 2026.
NOTE: New quarterly data not available until mid-to-late October 2026.
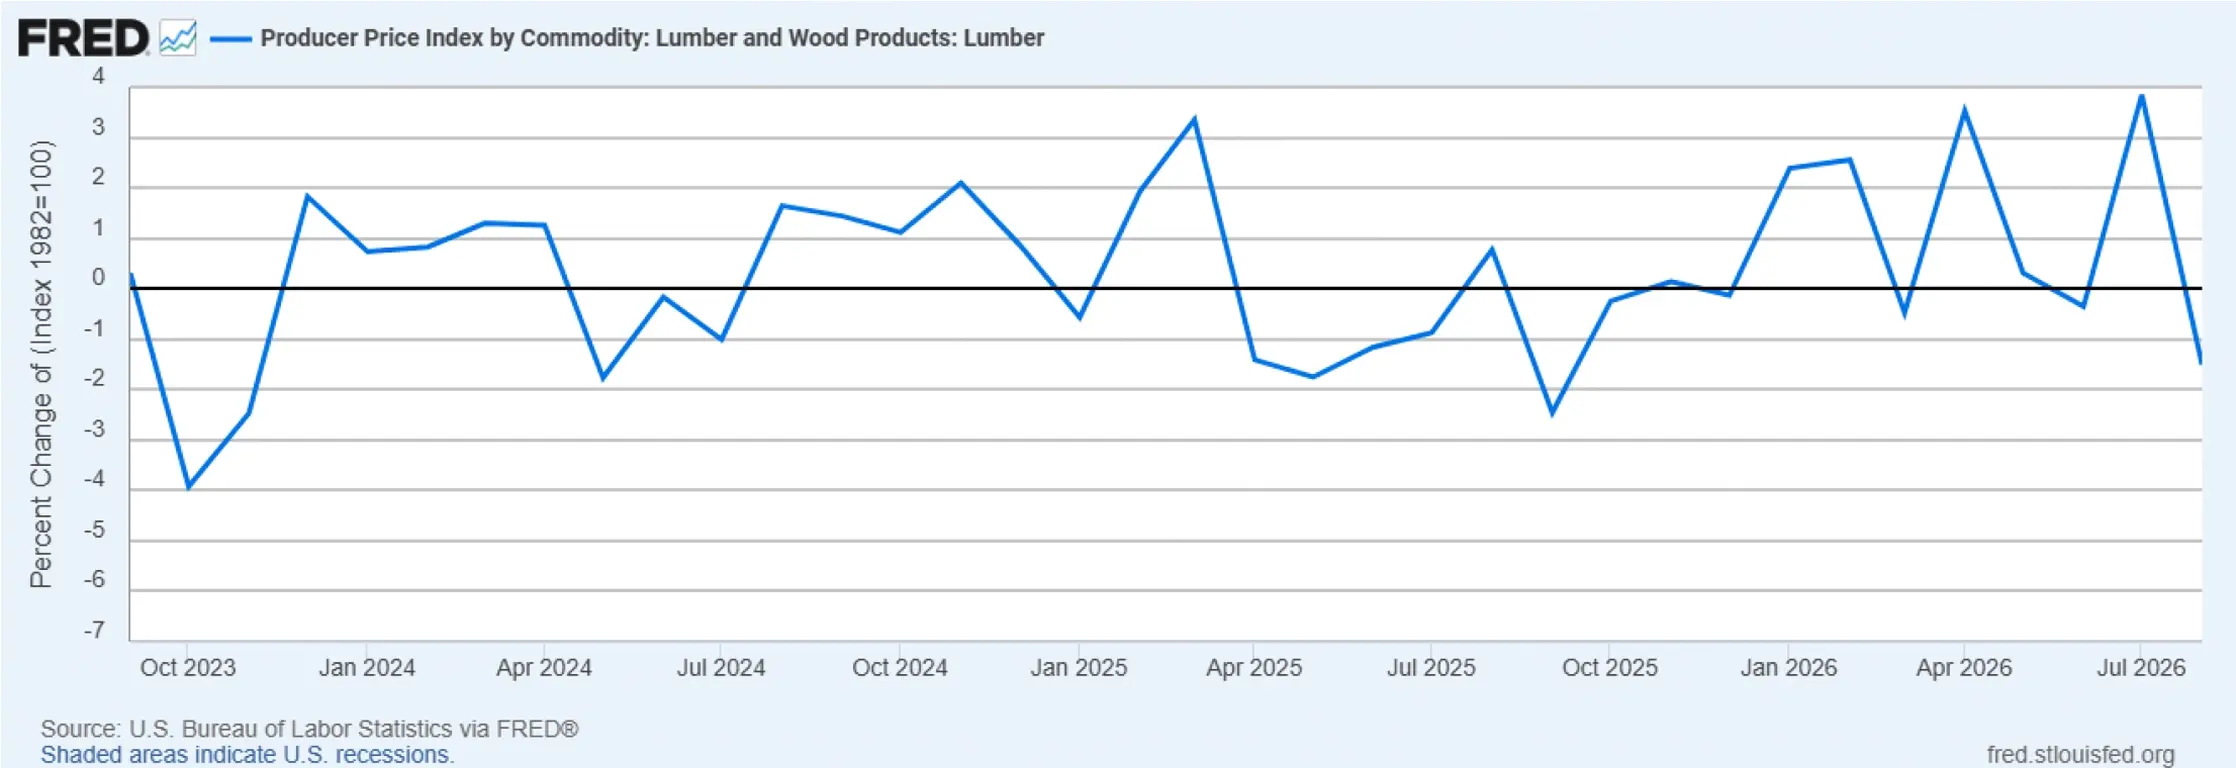
PPI: Lumber and Wood Products
The graph below details the Producer Price Index (PPI) pricing for lumber and wood products from September 2023 through May 2026.
NOTE: New quarterly data not available until mid-to-late October 2026.
Promotional Market Overview
Q4 2026
The promotional products industry continues to navigate a tariff regime change,
persistent geopolitical volatility and disciplined, diversified growth.
2026 Growth Is Priced In, Not Sold In
While PPAI's final 2026 figure will not be available until January 2027, U.S. promo is expected
to be sized at around $27.98B — up about 3% on price, not volume.
2026 Estimate
Estimated at $27.98B (range $27.5B - $28.38B) vs $27.1B actual in 2025.
Freight Volatility
Peak-season ocean rates run 40% - 80% above Q1 lows.
Landed Cost
Apparel duties average around 35%; new 10% - 12.5% layers stack on top.
Price-Led Growth
Approximately 90% raised prices around 11%; 93% expect 2027 sales to rise.
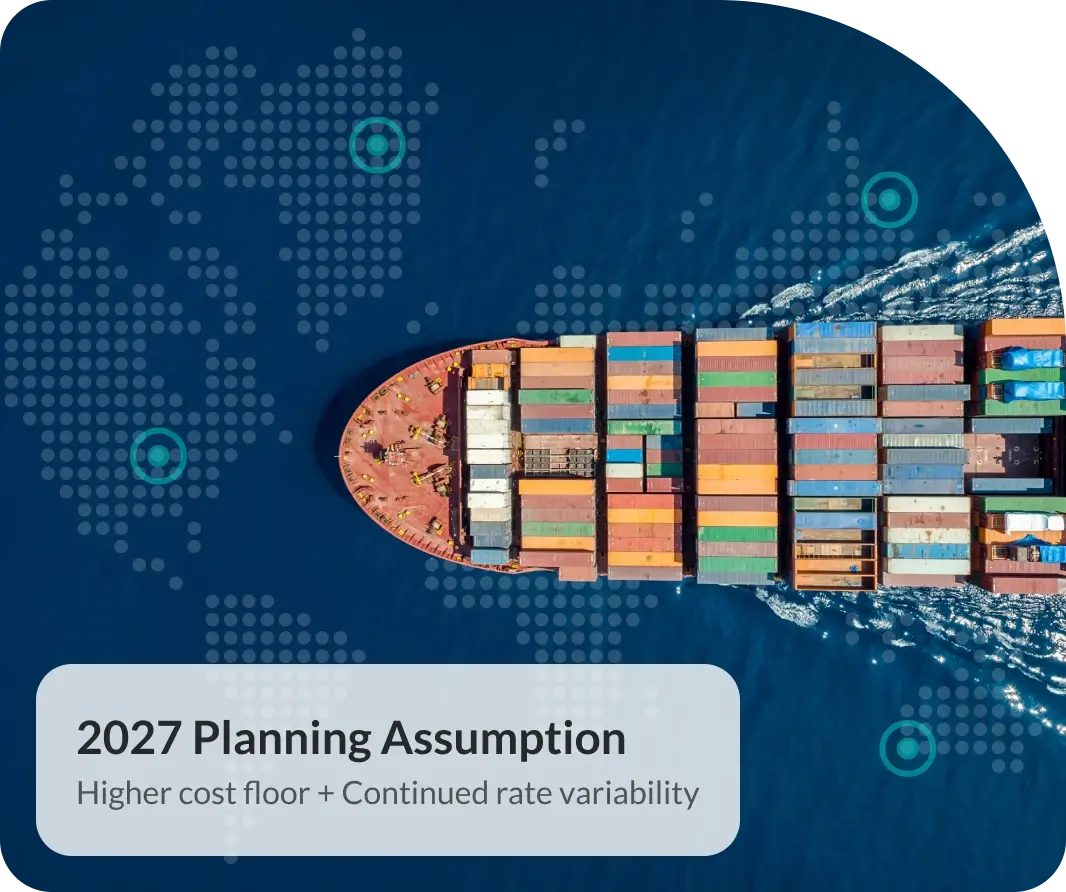
Response:
Price: Total landed cost
Plan: Demand signals
Diversify: Nearshore mix
Protect: Contingencies
From Lowest Cost to Most Resilient
With 2026 tracking to approximately $27.98B on price-led gains, the competitive
edge in 2027 will go to supply chains built for cost, speed and continuity.
Diversify
Shift volume toward nearshore and USMCA/CAFTA-DR routes, where qualifying goods can enter duty-free versus rates of 27% - 54% from Asia.
Simplify
Consolidate speed with proven suppliers and core SKUs. The South alone is 41% of U.S. promo sales (ASI).
Digitize
Use forecasting and supplier-risk signals to protect margin. 93% of distributors expect 2026 growth to hold.

2027 Priorities:
Proven suppliers
Core SKUs
Demand visibility
Disciplined cost adjustment
Logistics Market Overview
Q4 2026
The overall logistics market continues to experience momentum from rising
freight rates and capacity constraints heading into Q4 2026.
Q4 Small Package Outlook: Carrier Market Strategies
-
USPS
Financial pressures continue for USPS into Q4 2026 despite heavy focus on its "Delivering for America" business strategy. Additional peak season and general rate increases will impact shippers and consumers in Q4 holiday season. -
FedEx
FedEx continues to see parcel volume growth. FedEx Express small parcel division continues their ongoing Network 2.0 optimization initiatives. FedEx Freight is still seeing some service level issues after their spinoff, while hiring in customer service and technology is in process. -
UPS
UPS continues its "Better, Not Bigger” strategy, focusing on higher margin freight, network productivity, the renewed UPS Mail Innovations program, strong investment in RFID technology, UPS Healthcare expansion, and the implementation of hybrid postal solutions. UPS continues to invest in network efficiency and higher-quality freight over shipment volume growth. -
Amazon.com Services
The latest industry data indicates that Amazon Logistics now handles more parcel volume than the other traditional national carriers, reshaping competitive dynamics within the market. Amazon's small parcel infrastructure continues to expand throughout NA.
Less-Than-Truckload Logistics Market Overview for Q4
The North American LTL market is expected to remain carrier-favorable headed into Q4 2026 with continued pricing pressure, disciplined capacity management, and modest freight demand growth rather than a dramatic volume surge.
Capacity & Demand
-
LTL capacity is strengthening and tightening progressively through year end 2026.
-
A constrained broader truckload market is pushing more volume into LTL networks.
Carrier Pricing
-
As previously reported, LTL GRIs are expected to remain in the 5% – 7% range.
-
Spot rates remain high (double digits) compared to previous quarters.
-
High diesel fuel surcharge pressures persist with no near-term price floor.
Outlook
-
Most LTL carriers are expected to maintain acceptable service levels in Q4 2026.
-
Even so, shippers should anticipate longer lead times for certain North American shipping lanes, increased terminal congestion during peak season, reduced flexibility for last-minute shipments and greater focus on appointment management.
Q4 Truckload Logistics (TL) Market Overview
The North American TL market is expected to continue to experience capacity constraints. This is primarily because of a contracting carrier base and continued market exits, and not due to a significant surge in overall freight volume.
Capacity & Demand
- TL capacity remains available, but carriers are significantly more selective than in prior years.
- Key capacity drivers include continued carrier exits among small and mid-sized fleets, limited driver availability, equipment replacement exceeding fleet growth and stronger carrier discipline in freight selection.
- Manufacturing activity has expanded for much of 2026 and imports remain elevated, supporting TL volumes.
Carrier Pricing Strategies
- TL aggregate contract pricing remains elevated at approximately 18% YOY.
- Spot rates are forecasted to increase by 30%(+) YOY.
- Primary TL pricing drivers include capacity shortages, higher diesel fuel costs, increased labor wage inflation and Q4 holiday peak season volume surge.
Outlook
- Demand for TL freight should remain steady going into Q4 2026, while capacity is not expected to improve.
- Market conditions will put pressure on TL carriers to keep both spot and contract pricing higher going into Q4 2026 and into Q1 2027.
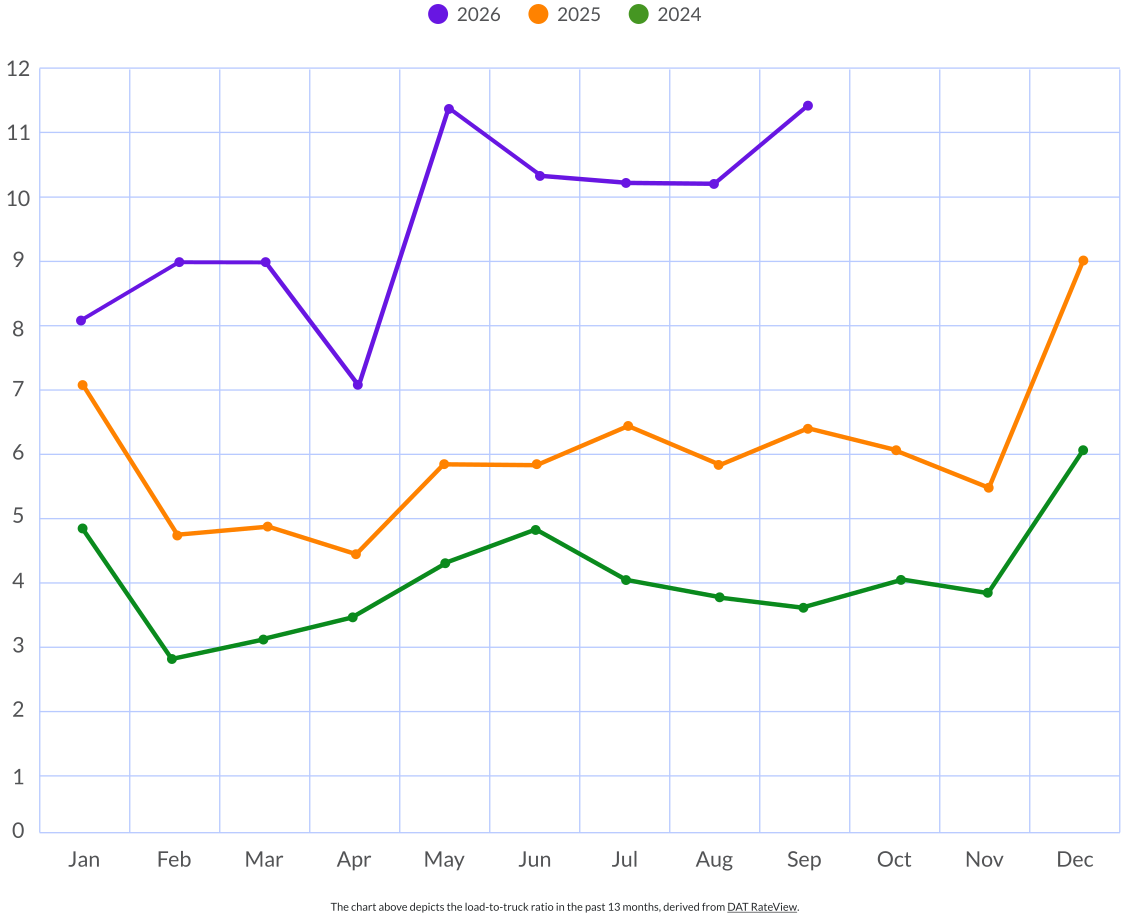
Van Demand & Load-to-Truck Ratio
Carriers remain focused on technology, network optimization and operational efficiency. September 2026 load-to-truck ratio readings show tight conditions across most of the country.
International (Imports) Market Overview
Q4 2026
roughly $60 billion of bilateral trade. Tariff refunds continue after the Supreme Court
ruling in February of 2026.
China and U.S. Pursue Tariff Reductions
Main Trade-Offs in the U.S.-China Tariff Package
As an importer, the biggest takeaway is that the U.S. appears willing to provide relief primarily on consumer-facing products such as toys, household goods and small appliances while China is offering relief on agricultural and industrial inputs.
China did not remove tariffs on U.S. soybeans, the biggest U.S. agricultural export to China.
There is no resolution addressing sensitive issues such as strategic industries, advanced technologies and economic competition.
Trade Truce Extension: What to Expect
The trade truce was extended through January 10, 2027. While both sides committed to continued negotiations, there is no agreement yet on various issues, including permanent tariff framework or long-term enforcement mechanisms.
There is no confirmed timeline for the agreement and reduction rate at the time of this update.
U.S. proposed tariff reductions focus mainly on Chinese consumer products, including:
- Toys and children's bicycles
- Coffee makers and toasters
- Tableware
- Blankets and bed linens
- Fireworks, artificial flowers, holiday decorations and child car seats
State of Tariff Refunds & Q4 Tariffs
ruled in February 2026 that the tariffs had been imposed without legal authority under
the IEEPA (International Emergency Powers Act).
Refundable Tariffs
-
IEEPA reciprocal tariffs (the country-specific 'Liberation Day' rates).
-
IEEPA fentanyl/trafficking tariffs (China, Canada, Mexico).
-
Use the IEEPA Tariff Refund Tracker to check status.
Non-Refundable Tariffs
-
Section 232 tariffs (steel, copper, aluminum, autos) - not struck down.
-
Section 301 tariffs (China) - not struck down.
-
Section 122 (the 10% replacement tariff) - expired July 24 and replaced by the 301 forced-labor tariffs, which are not refundable.
-
Standard MFN duties.
State of Tariffs in Q4 2026
Current Refund Status
Phase 1 (Live): Unliquidated entries and certain entries within 80 days of liquidation.
Phase 2 (Live): Reconciliation-related entries and certain AD/CVD-related entries.
Phase 3 (Scheduled): Final liquidated entries, with deployment reported for October 6, 2026. Access is reportedly limited to certain plaintiffs in pending Court of International Trade cases.
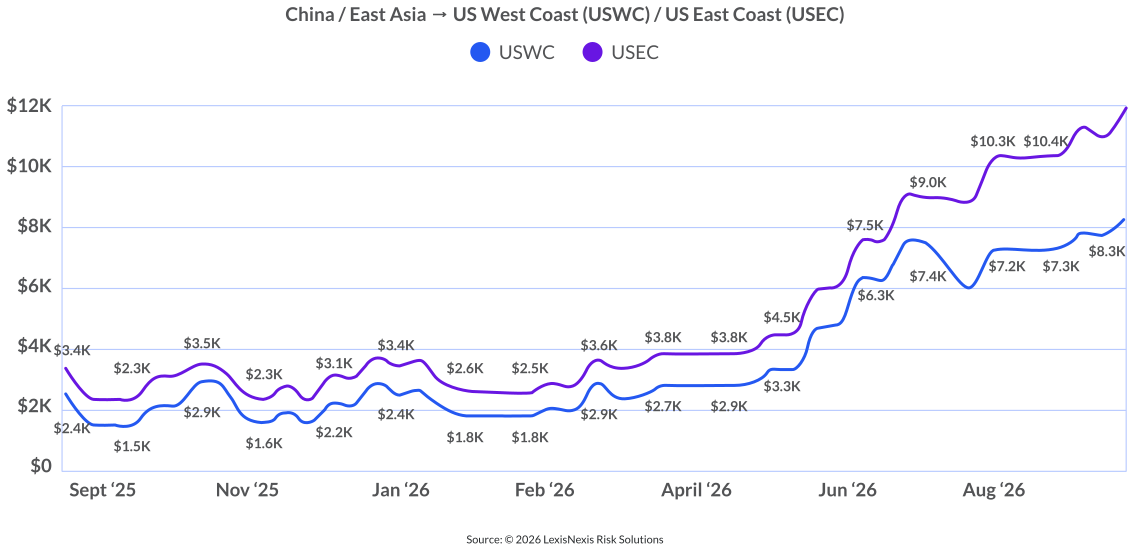
International Logistics Market Rate Per Full Container Unit
Graphics Market
Q4 2026
The graphics market remains positive, with wide-format printing generally growing at a mid-single-digit rate.
Retail signage is still a core source of volume, but growth is shifting toward customized graphics,
experiential displays, textiles, décor and specialty applications.
Key Developments
Retail programs are becoming shorter and more localized.
- Brands are ordering smaller quantities, changing campaigns more frequently and tailoring graphics by store or region.
- This favors digital print and suppliers that can provide quick-turn, versioned substrate programs.
Sustainability is now a purchasing requirement.
-
Retailers increasingly want recyclable, recycled-content, FSC-certified and PVC-free materials — not simply environmental claims.
-
Polypropylene, polyethylene, paper-based display board, fiber composites and fabric are gaining consideration as alternatives to traditional PVC products.
Paperboard and fiber-based displays have momentum.
-
Corrugated and solid-fiber display materials are benefiting from their recyclability, light shipping weight and suitability for temporary promotions.
-
Demand is strongest for modular systems that can be refreshed, re-skinned or reused.
-
Premium print quality and finishing remain necessary; retailers do not want sustainability to produce a lower-end appearance.
Soft signage continues to grow.
-
Dye-sublimated fabric, silicone-edge graphics and tension-fabric systems are expanding in retail, events and branded interiors.
-
Advantages include lighter freight, compact storage, reuse and an upscale appearance.
-
Textile-related applications are among the market’s faster-growing areas.
Rigid substrates remain important but the mix is changing.
-
Foam PVC, styrene, acrylic and traditional display boards still serve durability and structural requirements.
-
However, buyers are evaluating paper-faced boards, honeycomb structures, polypropylene sheet and other lower-PVC options — especially for short-life indoor work.
UV, latex and water-based technologies are expanding substrate options.
-
UV-LED systems support printing on a broad range of rigid and flexible materials, while latex and water-based platforms are attractive for odor-sensitive indoor retail environments.
-
Ink compatibility, coating requirements and recyclability still need to be assessed together.
Commercial Pressures
Margins remain challenged by labor, freight, energy, raw-material costs and increasingly complex jobs. Retailers expect faster delivery, more versions, lower minimum quantities and stronger sustainability documentation — often without accepting higher prices. Consolidation and strategic acquisitions among print providers and equipment suppliers are therefore likely to continue.
Implications for Substrate Purchasing
-
Maintain multiple material pathways rather than relying on one universal substrate.
-
Compare total installed cost, including freight, finishing, labor and disposal — not just sheet or roll price.
-
Request substantiated environmental documentation, including recycled content, certifications and realistic end-of-life options.
-
Prioritize lightweight, modular and reusable solutions for multi-location retail programs.
-
Qualify alternatives by application, because PVC-free does not automatically mean recyclable or lower impact.
-
Expect continued demand for traditional materials, but with gradual share movement toward fiber-based boards, non-PVC films and textiles.
Key Takeaways
Retail sign and graphic demand is healthy, but the winning substrate mix is shifting toward short-run flexibility, credible sustainability, lighter logistics and compatibility with automated production.
Traditional vinyl and rigid plastics will remain significant, although their use will become more application-specific as retailers pursue recyclable and reusable alternatives.
Compliance & Regulatory
Market Overview for Q4 2026
PFAS in Products:
New Mexico Product Labeling Requirements
What's Changing
- On September 16, 2026, the U.S. District Court for the District of New Mexico issued a preliminary injunction blocking enforcement of New Mexico's PFAS product-labeling requirements under 20.13.2 NMAC that were scheduled to apply to products manufactured after January 1, 2027.
- The ruling is limited to the labeling provisions and does not affect other requirements of New Mexico's PFAS Protection Act (HB 212).
- HB 212 remains in effect, and companies must continue to evaluate and comply with all applicable non-labeling PFAS requirements.
The Impact
- The injunction temporarily reduces the immediate compliance burden associated with New Mexico's PFAS labeling requirements; however, it does not eliminate other regulatory obligations under HB 212.
- Teams must obtain product compliance approval for all regulatory labeling, warning statements, and legally required product disclosures.
- Regulatory related artwork and content, includes warning statements, ingredient declarations, nutrition information, country-of-origin statements, safety markings and other required disclosures.
- Failure to maintain approved regulatory content may result in noncompliant labeling, regulatory violations, customer impacts and potential legal exposure.
Consumer Product Safety Commission (CPSC)
Product Safety & Recall Regulations
What is changing?
- Increased enforcement activity involving consumer products.
- Greater emphasis on hazard identification and corrective action.
- Expanded expectations for product safety documentation and supplier controls.
What is the impact?
- More supplier declarations required.
- Additional testing support documentation.
- Increased review of compliance statements.
- Greater customer request activity.
FDA Material Compliance:
Food Contact Substance & Packaging Requirements
What is changing?
- Increased scrutiny of chemicals used in food-contact materials.
- Greater customer demand for evidence supporting food-contact compliance.
- Growing focus on substances of concern, including PFAS and migration risks.
What is the impact?
- More supplier declarations required.
- Additional testing support documentation.
- Increased review of compliance statements.
- Greater customer request activity.
FDA Food Traceability Rule
U.S. Food and Drug Administration FSMA Section 204
What is changing?
- Requires maintenance of Key Data Elements (KDEs) for Critical Tracking Events (CTEs).
- Requires rapid retrieval of records for FDA requests. Expands traceability requirements across the supply chain.
What is the impact?
- ERP and inventory tracking system upgrades.
- Enhanced supplier-to-customer traceability.
- Faster recall response capabilities.
- Increased documentation and audit requirements.
- Additional burden for food packaging and food-contact suppliers.
Extended Producer Responsibility (EPR)
What's Changing
- Extended Producer Responsibility (EPR) regulations continue to expand across the United States, with multiple states, including California, Colorado, Maine, Maryland, Minnesota and Oregon, implementing EPR programs at various stages of effectiveness and enforcement.
- These regulations transfer responsibility for funding and managing the collection, recycling and end-of-life management of covered packaging and products from local governments and taxpayers to the product "producer" or brand owner.
- Additional states are actively considering similar legislation, increasing the likelihood of broader national EPR requirements.
The Impact
- EPR regulations may increase compliance obligations, reporting requirements and financial responsibility for packaging and products sold into covered states.
- Teams may be required to collect and report packaging material data, participate in Producer Responsibility Organizations (PROs), pay EPR fees, and support recycling and waste-management programs based on the types and quantities of packaging placed into the marketplace.
- As EPR programs expand, teams will need to have enhanced visibility into packaging composition, supplier data, product distribution by state and packaging reduction initiatives.
- Early compliance planning can help minimize future costs, support sustainable packaging goals and reduce regulatory risk associated with noncompliance.