Skip to Content

Material Matters from Taylor - Q1 2026

Your quarterly update on the latest sourcing trends, market pricing and the overall state of supply chains.

Research
Material-Matters-Hero

Sourcing and Supply Chain Updates

Read on to get the latest news for the paper, label, packaging, promotional, logistics,
import markets (including tariffs), regulatory and compliance updates, and color management.

01

Market Overview

Q1 2026 Market Trends and Economic Indicators

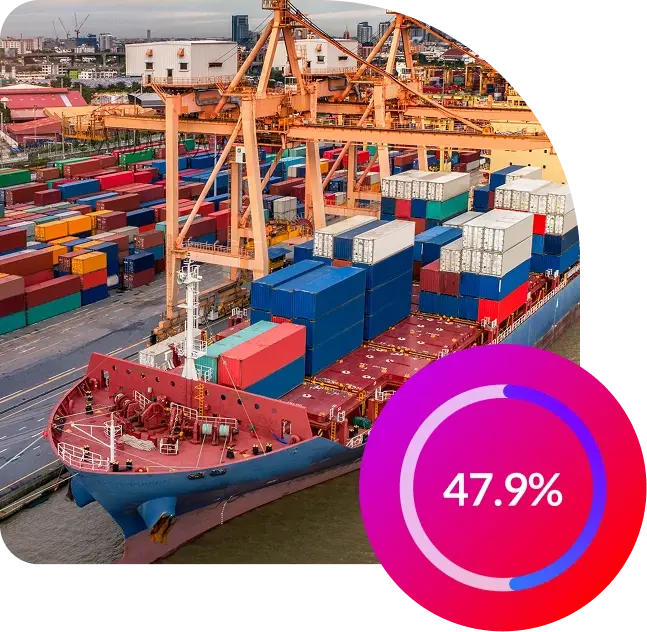
Institute of Supply Chain Management (ISM) manufacturing PMI index finished at 47.9% in December 2025. This represents the 10th straight month of manufacturing sector contraction.

New orders, backlogs, production and raw material inventories all contracted at slower rates while overall prices continue to remain stable from previous months. The index still points to growth in the U.S. economy (GDP increased to 4.3% for Q3 2025) primarily driven by consumer spending, exports and government spending despite manufacturing contraction.  ​

Market_Overview_47.9
Leadership-Changes​-Icon

Consumer Spending/Sentiment

Consumer sentiment continued to decline for the second month in a row. The University of Michigan's Index of Consumer Sentiment increased slightly to 52.9 in December 2025 from the previous month.

Expectations are that consumer sentiment will remain same going into Q1 2026. Primary drivers for little-to-no change include higher consumer goods and services prices, pessimism about the labor market, higher out-of-pocket healthcare costs, and strained household budgets/income.

Inflation-Interest-Rates-Icon

Commodity Pricing

Commodity pricing is mixed among heavy metals, chemicals, plastics, packaging and energy components with aluminum, steel, copper, natural gas, paper products and electronic components seeing higher rates of increasing prices.

Standard gasoline, oil and polypropylene resin are all seeing lower pricing. The U.S. tariff policy remains a focus for both manufacturers and consumers. (See Imports section for more details.)

Energy-Icon

Energy

WTI crude oil, U.S. diesel fuel and standard gasoline are all expected to continue to be lower and/or flat in Q1 2026. This is primarily driven by lower WTI (U.S.) and Brent Crude (global) oil prices due to lower demand and higher production and inventories.

Natural gas pricing is expected to remain stable at $4/MMBTU. Keep in mind that the current situation in Venezuela should have limited impact on oil pricing with the current global surplus and OPEC production strategy.

Inflation & Interest Rates

Consumer Price Index (CPI) finished at 2.74% at the end of November 2025 and is 0.11% less than last reported in September 2025.  Some industry analysts predict this to increase slightly to 3% by Q1 2026 due to continued tariff impact and tight labor market. Some of this forecast sentiment is based upon tariff impact on consumer prices.​

The Federal Reserve cut interest rates by another 0.25% in December 2025 to a target range of 3.50% to 3.75%. This is in line with expectations as policymakers take a cautious approach to support economic growth amid softening labor market.
02

Paper Market Overview

On December 4, Sappi Limited and UPM Kymmene Corporation announced the signing of a non-binding letter of intent to form an independent 50/50 joint venture in the European graphic paper market. Sappi Europe announced a coated groundwood price increase of 5%–7% on rolls effective Jan. 1, 2026.  

As expected, EUDR legislation was postponed from the end of 2025 to the to end of 2026. This is welcome relief for printing papers becoming exempt from legislation that was finalized mid-December.    

Printing and Writing Papers

Neenah, Mohawk, Pixelle and Sylvamo announced price increases effective Q1 2026.

Shutdowns contributed to significant shifts in the uncoated paper market in 2025 and these will continue to be felt in 2026.

Capacity-Demand-Dynamics-Icon

Price Increases

Neenah and Mohawk appear to be making standard annual increases, while Pixelle’s price increases reflect their ongoing instability following the Chillicothe, OH, plant shutdown and continued restructuring.

Pricing-Strategies-Icon

Uncoated Paper

Q1 2026 is expected to see tighter supply and additional price increases in the uncoated paper market, primarily due to overall industry capacity reductions, such as Sylvamo’s Rivervale mill closure and Pixelle’s planned pulp mill shutdown in March 2026.

Outlook-Icon

Tariff Impact

Tariffs implemented in 2025 will also impact the paper industry going into 2026. Maintaining strong relationships with preferred mill partners will be essential for supply continuity during these market disruptions.​

Envelope Industry Update

The envelope sector remains challenged. Envelope One is still in bankruptcy, and smaller manufacturers are struggling, especially with paper supply, as mills increasingly drop small converters as customers. Continued fallout from mill closures and mill repurposing is expected to create further pressure.

Paper Mill Shutdowns & Conversions (2025 Total)

Paper Company / Mill Location Timing
UPM Ettingen, Germany: (270,000 tons of uncoated mechanical) Q3 2025
Irving Paper, Saint John, NB: PM2 (200,000 tons of SCB, hi-bright and newsprint) Q2 2025
Greif, Los Angeles Mill: (72,000 tons of coated and uncoated recycled paperboard) Q2 2025
Metsä Board Tako Mill, Tampere, Finland: (210,000 tons of folding boxboard) Q2 2025
Kabel Mill, Germany: (260,000 tons of coated groundwood) Q2 2025
Sappi Kirkniemi, Finland: PM2 (1 of 3 machines – 175,000 coated mechanical) Q3 2025
Pixelle Specialty Solutions, Chillicothe, OH: (400,000 tons of uncoated freesheet/carbonless) Q3 2025
Domtar, Grenada, MS Newsprint Mill: (235,000 tons; 35% of Domtar total) → ~10% reduction of North American newsprint capacity Q3 2025
International Paper, Riceboro, GA, and Savannah, GA: (1.43M tons of containerboard collectively) → Total industry containerboard impact is 3.5M tons or 8.5% of NA capacity Q3 2025
Georgia-Pacific, Cedar Springs, GA Mill: (1M tons of containerboard) Q3 2025
UPM Kaukas, Finland: PM1 (300,000 tons of coated mechanical)→ UPM has reduced graphic paper production by 13% in 2025 Q4 2025
Sappi, Alfeld, Germany: (2 paper machines + sheeter affecting packaging board grades) Q4 2025
Georgia-Pacific, Mt. Olive, IL: (corrugated box) Q4 2025

North American Coated Coated Freesheet Operating Rates

NA_CoatedFreesheet_OperatingRates

North American Uncoated Coated Freesheet Operating Rates

NA_UncoatedFreesheet_OperatingRates

03

Label Market Overview

Q4 2025 raw material pricing remained stable with both customers and suppliers concerned about slower
demand and higher inventory values.  Q1 2026 pricing is expected to see some upward pressure on both
paper and film-based products due to global tariff impact on their business.  

The supply of general label material is expected to be sufficient for North American demand.

Paper Facestocks and Liners​

  • Thermal paper and paper liner material supply and demand remain balanced with continued emphasis on CA Prop 65 and WA Phenol-Free product requirements. There is potential for upstream paper mill consolidation and/or planned shutdowns in favor of higher value products. 
  • Global supply and lead times on standard products are expected to remain stable with longer lead times for specialty paper-based label materials.
  • Platinum prices continue to hit all-time highs surpassing $2,000/ounce.  It is expected that platinum prices will push even higher in 2026 due to operational disruptions and rising mining costs. Ultimately, platinum pricing will put pricing pressure on silicones used for label liner manufacturing costs in 2026.
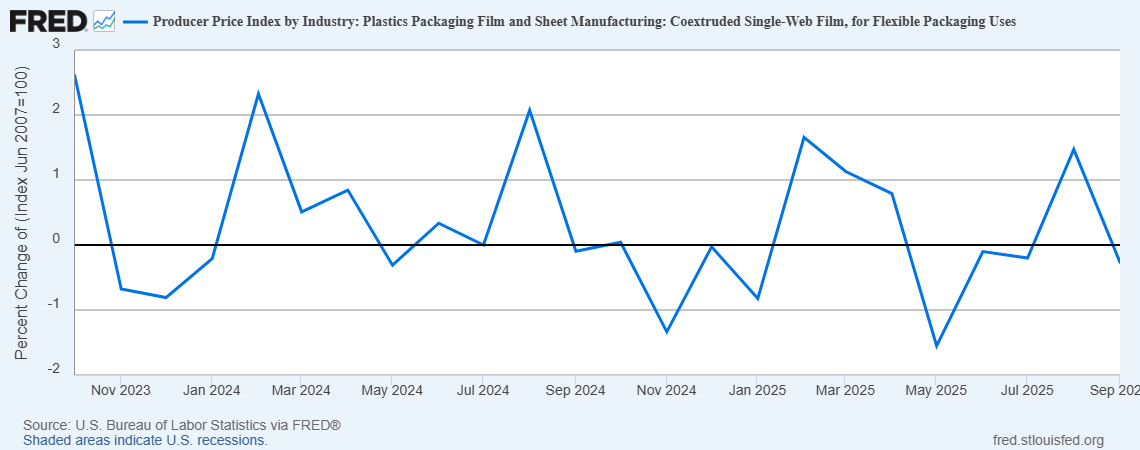
Label-Market-Overview

Films and Adhesives​

  • BOPP and PET film prices are expected to see slight increases in market pricing in Q1 or Q2 2026, primarily driven by manufacturers strategically lowering production utilization rates and capacity, and tariff impact on imported plastic resin materials. Overall BOPP, PET and other filmic raw material supply is expected to be sufficient for North American and global demand.
  • Acrylic and hot-melt adhesive supply and demand is expected to remain stable into the first half of 2026. Raw material input costs for adhesives seem to be holding steady both domestically and internationally.

Labels PPI​

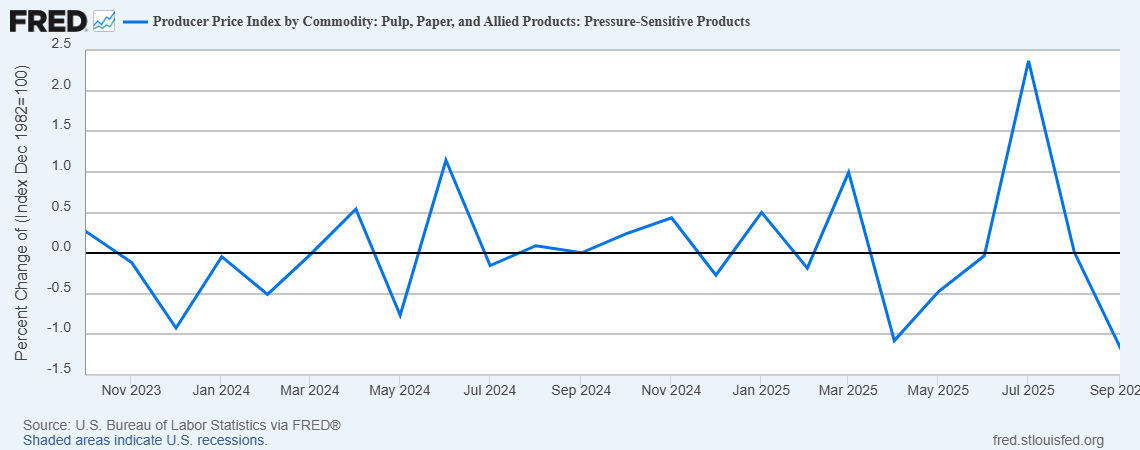
The graph below details the Producer Price Index (PPI) for raw label pressure-sensitive materials from September 2023 through September 2025.

**NOTE** New quarterly data not available until mid-to-late January 2026. ​

PPI_Labels_FRED_graph


04

Packaging Market Overview

The overall packaging market continues to show some instability due to tariffs, paper mill closures,
consolidation and overall North American demand.

Aluminum​ & Tooling/Die Categories

  • Aluminum material pricing is expected to remain stable through Q1 2026, but tariffs are significantly impacting CTP equipment, with aluminum raw materials continuing to be the most affected.
  • Processless plates continue to be a rising trend in the overall plate making market. 
  • Aluminum plates are showing moderate growth and expected to continue into 2027.
  • Tooling and die markets have implemented price increases and/or tariff surcharges, driven by both material costs and trade policy shifts.
Packaging-Market-Overview

Corrugated & General Packaging Supplies Update

  • Pricing is expected to remain flat moving into Q1 2026. 
  • The corrugate market is projected to continue growing through 2026, fueled by ecommerce and food packaging demand.
  • Tariff concerns persist, especially due to the active trade of roll stocks between the U.S. and Canada.
  • Foil markets are showing instability with a price increase coming during Q1 2026.

Wood Pricing​

  • Used pallet pricing should remain stable through the remainder of 2026. Raw materials for used pallet production
    remain in abundance throughout the U.S. A slower new housing market is resulting in a surplus of new lumber.
  • Tariff changes between the U.S. and Canada remain a concern since lumber utilized in the Midwest is primarily imported from Canada.

PPI: Flexible Packaging Film​

The graph below details the Producer Price Index (PPI) pricing for flexible packaging film from September 2023 through September 2025.

 ​**NOTE** New quarterly data not available until mid-to-late January 2026.  

PPI_FlexiblePackagingFilm_FRED_graph

PPI: Lumber and Wood Products​

The graph below details the Producer Price Index (PPI) pricing for lumber and wood products  from September 2023 through September 2025.

​**NOTE** New quarterly data not available until mid to late January 2026. 

PPI_LumberWoodProducts_FRED_graph
05

Promotional Market Overview

As Q1 2026 begins, we take a look at key trends and developments that took shape in 2025
and will continue to impact the promotional sector in the coming year. 

2025 Year-End Reflection: Preparing for 2026

  • Industry Pivot
    Promotional products sector shifts toward responsibility and resilience.
  • Key Imperatives
    Sustainability and compliance are now non-negotiable. Tariff pressures and global complexity demand smarter sourcing strategies.
  • Technology as a Lever
    Adoption of AI-driven forecasting, automation and digital compliance tools boosts efficiency.​
  • Market Drivers
    Personalization and operational agility highlighted as success factors.
  • Roadmap for 2026
    Competitive advantage will hinge on creativity, compliance and digital intelligence.
06

Logistics Market Overview

The logistics industry continues to navigate a global price-sensitive environment driven by persistent tariff fluctuations, USMCA policy negotiations, and a balanced but fragile capacity landscape. Retailers are cautiously optimistic going into Q1 2026, though company and personal debt pressures along with inventory deflation may reduce freight volumes.
Global seasonal holidays are expected to extend inventory shortages as well as capacity imbalances.  The Taylor team will continue to align with optimal logistics partners to support business needs in 2026.

Small Package Market Overview

The small parcel shipping market faces a complex landscape of ample capacity and soft demand, with carriers employing aggressive strategies to offset volume challenges through pricing mechanisms. ​

Capacity-Demand-Dynamics-Icon

Carrier Capacity

Major carriers (UPS, FedEx, DHL, USPS) are expected to have stable capacity, but last-mile congestion will continue due to holiday season spillover and same-day delivery demand.

Carriers continue to invest in AI-driven technology for route and load optimization, micro-fulfillment hubs, and enhanced real-time shipment visibility. ​

Pricing-Strategies-Icon

Pricing Strategies

Q1 2026 will continue to see General Rate Increases (GRI) averaging 7%–12%:

UPS
5.9% effective 12-22-25
FedEx
5.9% effective 1-5-26
DHL
5.9% effective 1-1-26
USPS
7.8% GA
6.6% Priority effective 1-18-26

Shippers are expected to reassess packaging and carrier mix to help offset additional logistics costs.​

Outlook-Icon

Outlook

​Shippers must continually evaluate packaging and service level mix, have strong strategic relationships with carrier partners and leverage technology platforms (e.g., AI; TMS). ​

Less-Than-Truckload Logistics Market Overview

The North American LTL market enters Q1 2026 with greater stability than in 2025, but continues to feel the effects of changes across the freight ecosystem. LTL market conditions remain consistent with late 2025, reflecting a soft domestic freight environment and muted economic activity.

The LTL market is expected to impacted less by sudden demand spikes and more by structural constraints, including tighter capacity, compliance pressures and evolving cross-border freight movement, especially with Mexico. Although LTL freight volumes remain below pre‑pandemic levels, modest recovery continues in sectors tied to industrial production and cross‑border trade, aligning with early 2026 freight stability indicators.

Carrier Capacity

Capacity remains tight, primarily due to continued freight volume being redistributed after previous carrier consolidation and/or complete exiting from the market. Fewer drivers and constrained network flexibility within specific North American regions has also contributed to forecasted LTL capacity trends in 2026.​

Pricing Strategies

LTL rate pressures are expected to persist into Q1 2026. While contract rates remain relatively steady, accessorials and surcharges — especially fuel‑related and service‑specific fees — are increasing, consistent with broader transportation cost inflation trends. Read more about the LTL landscape at mynatsa.org.

Outlook

Shippers must prepare for continued rate pressure, tight capacity and longer lead times. Strategic carrier selection, technology adoption and flexible routing will be key to maintaining service levels. The Taylor sourcing team will continue to align with reliable LTL partners to support business needs through Q4 2025 and into 2026.​​

LTL-Outlook

Truckload Logistics Market Overview

The North American truckload sector enters 2026 with more clarity than in
prior years, but remains shaped by soft freight demand, capacity normalization,
regulatory tightening, and tariff-related cost pressures. Structural shift versus
sudden demand surges are driving market behavior early in 2026. 

Capacity & Demand

  • Capacity is tightening in key regions as early signals of reduced driver availability and carrier consolidation are emerging especially in the Southeast, Midwest, Texas and Mountain West regions. 
  • Expectations are that truckload capacity should normalize between spring and summer 2026.

Rates & Pricing

  • Spot rates are expected to have slight increases in early 2026 followed by some softening in Q2 2026. 
  • Contract rates are expected to remain stable. Increases are unlikely unless demand rises significantly above spot levels.​  

Outlook

  • Shippers should prepare for ongoing spot market volatility. With regional capacity and demand in balance, having multiple logistics supplier options is going to be critical.  
  • Technology platforms to make accurate, real-time logistics decisions will be key to supporting operations and customer demand.​ 

International Logistics Market Overview

The international logistics market in Q1 2026 is expected to be defined by a move toward stabilization and normalization. Geopolitical risks, global shipping ports congestion, network inefficiencies and logistics supplier capacity management strategies are causing significant volatility in specific global sectors.

Ocean Freight

F​or shippers, ocean freight rates are no longer only based upon demand, but how they are impacted by geopolitics and global network design. Ocean freight insurance costs in some cases are as high as 250% from the previous year.

Air Freight

Volumes rose 5%–7% YoY, driven by Asia-Pacific markets and cross-border ecommerce. AI-driven forecasting tools continue to be mainstream among carriers in helping manage capacity and optimize routes.​​

Chinese New Year

A key event in 2026 to be aware of is the impact of the Chinese New Year holiday in mid-February 2026, which is expected to create short-term capacity tightening and rate increases back to shippers.​

Outlook

In preparation for the Chinese New Year in February, import shipments to the U.S. will need to be scheduled to secure capacity. It will be critical to mitigate international supply chain risk by using multi-modal options as well as strategic partnerships with 3PL providers and international freight brokerage suppliers. ​​

Van Demand & Capacity

Van_Demand_Capacity


Van Load-to-Truck Ratio

Van_LoadTruck_Ratio


U.S. Postal Service Market Updates

New USPS Pricing Changes

  • Effective January 18, 2026
  • USPS Ground Advantage
    7.8% increase
  • Priority Mail Service
    6.6% increase
  • Parcel Select Service
    6.0% increase
  • First-Class Mail Stamps
    Pricing remains unchanged at its current 78-cent rate

USPS Network Modernization

  • Lobby Technology Platform & Service Enhancements
    Rolling out modernized lobbies with smart lockers and kiosks through 2025 and 2026
  • "Last Mile" Access:
    Opening up the USPS delivery network (DDUs) to other logistics companies starting early 2026

USPS Operational Improvements

  • Vehicle Rollout
    Thousands of new vehicles are already on the road, with plans to reach 35,000 electric vehicles  in service soon 
  • Capacity Boost
    Increase daily package processing capacity significantly by adding new sorters​ 
  • Workforce
    Converting many temporary employees to full-time roles and
    stabilizing the workforce

USPS Rate Increase Proposal

​USPS filed a proposal seeking greater flexibility to raise prices beyond CPI‑based limits to compensate for financial losses and falling mail volumes. The proposal does not address service or performance improvements.​

Reminder: New 2026 Promotions

USPS_Promotion Calendar_2026

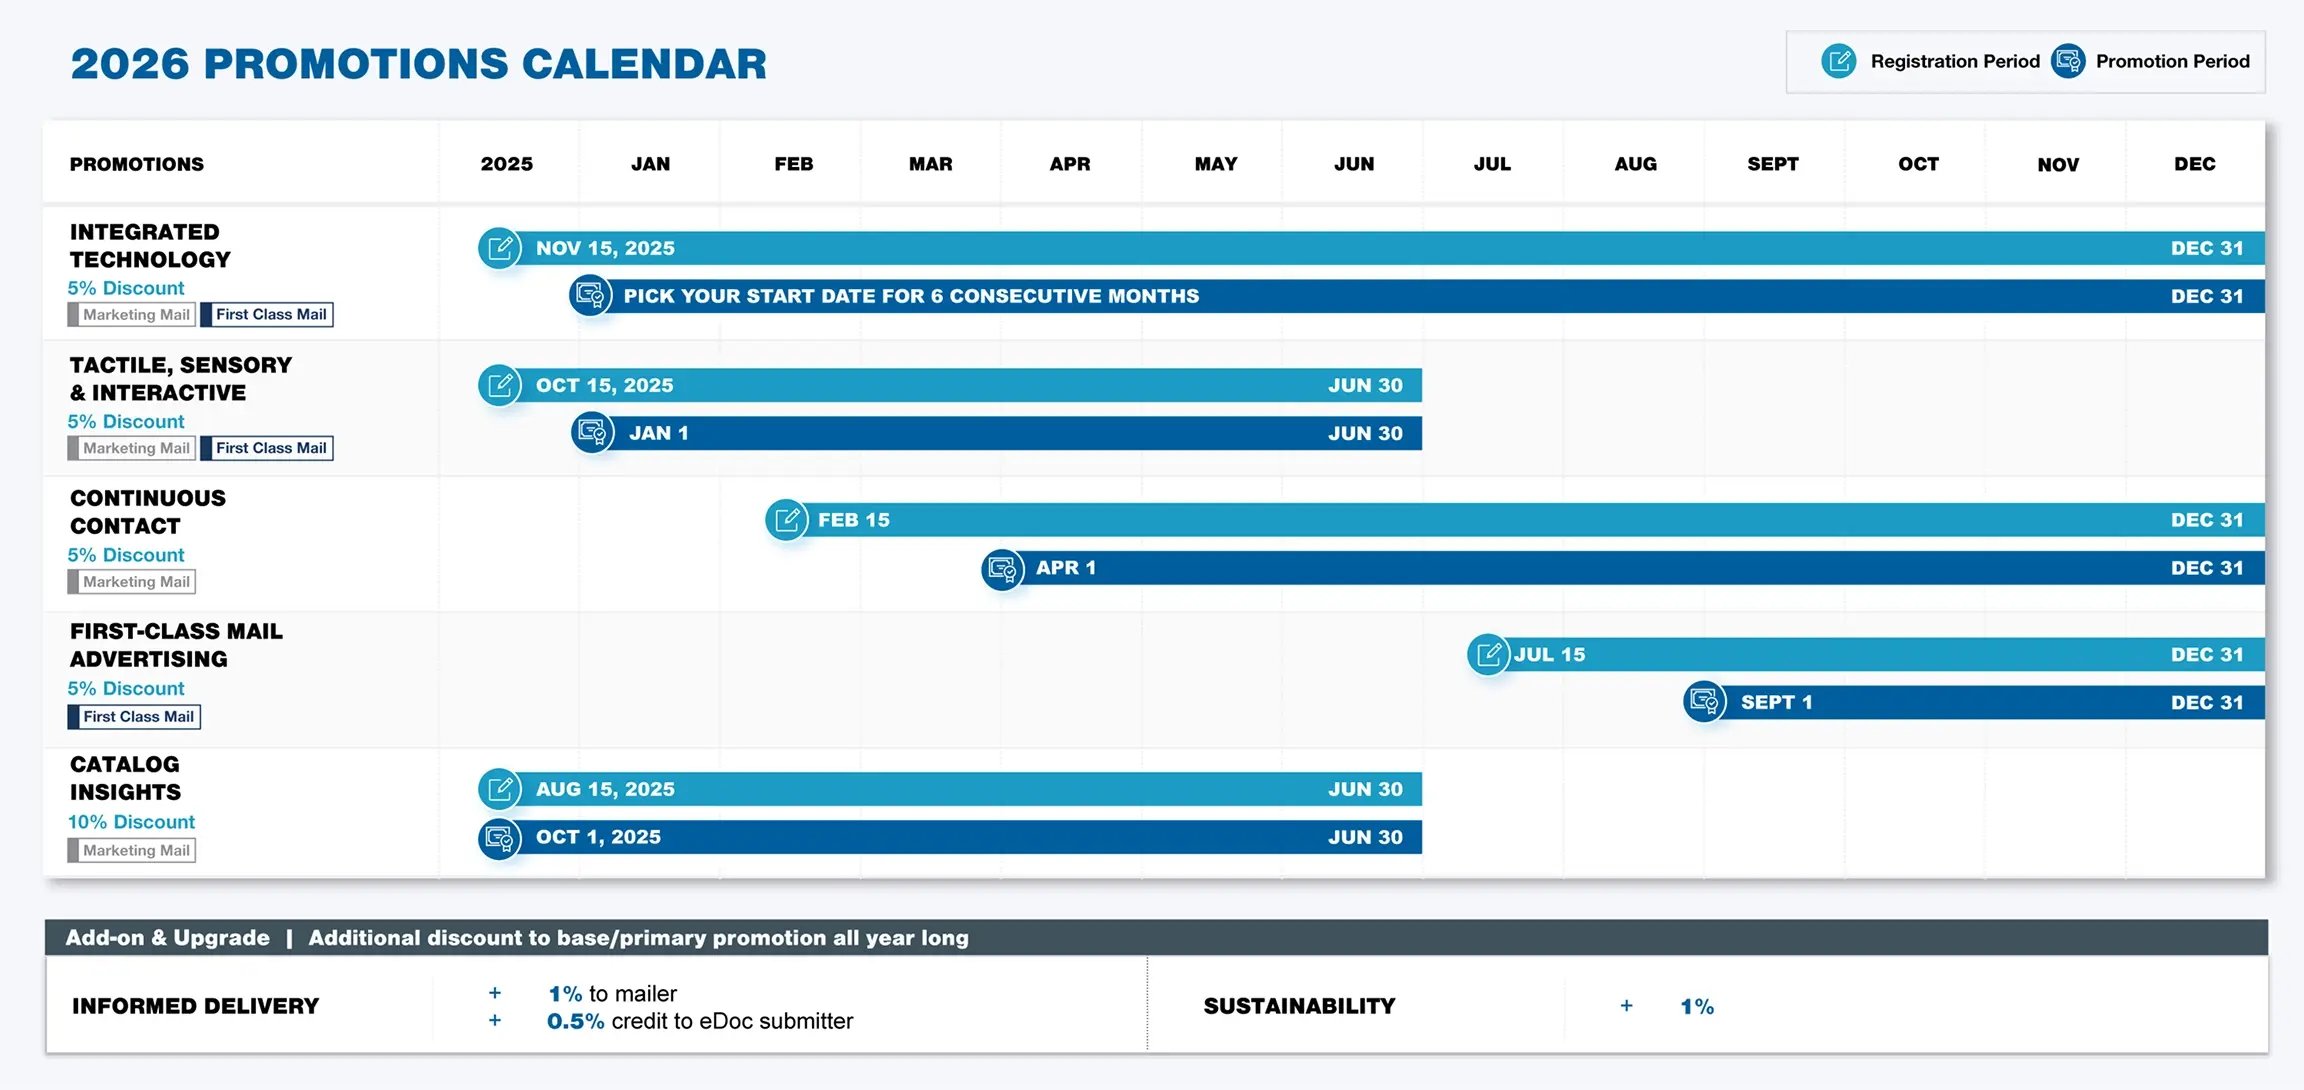
  • Registration for catalog insights was effective as of Aug. 15, 2025. Tactile, sensory and interactive promotion registration started Oct. 15, 2025.
  • All the New 2026 Promotions: 2026 Promotions Guidebooks | PostalPro
07

International (Imports) Market Overview

​After a year of tariffs in 2025, the USMCA will be in the spotlight in 2026. The Supreme Court's final ruling on the legality of IEEPA tariffs is highly anticipated. 

Global tariff policy is changing frequently. Updates will be presented by the Taylor Sourcing Team as necessary. 

U.S. - Mexico - Canada Free Trade Agreement (USMCA)

Potentially the most important trade policy news this year will be the outcome of negotiations over the United States-Mexico-Canada Agreement (USMCA).

In December, U.S. Trade Ambassador Jameson Greer briefed Congress on the administration's goals and positions heading into the six-year review of the trade deal.

While Greer did not explicitly commit to renewing the USMCA and indicated that the United States would negotiate aggressively during this process, the administration has indicated it favors nearshoring in North America over other alternatives.

International-Market-Overview

Current State

“The USMCA has been successful to a certain degree,” said Greer. “As you can see from the information we have received from interested stakeholders, there is broad support for the Agreement." 

July 2026 Decision

As negotiations progress toward a July 2026 decision, vigorous debate is expected on specific commodities, country-of-origin rules that determine the material basis for tariffs, and trade diversion from countries outside the agreement.​

Customs Update | C.H. Robinson

The Year of the Tariff

Read the op-ed by Ambassador Jamieson Greer: The Year of the Tariff

U.S. Supreme Court Final IEEPA Ruling

Upcoming Decision

Analysts have been waiting for a ruling on the U.S. Supreme Court IEEPA tariffs case, with many expecting it to come by the end of January 2026.

Possible Effects

The decision is one of the most anticipated events of the year, as it could create refunds for importers, raise questions about the preliminary trade pacts the U.S. has struck and renew concerns about the fiscal deficit.

Budget Office Estimate

The tariffs are expected to subtract $3 trillion from the deficit over 10 years, according to the latest Congressional Budget Office estimate. The Yale Budget Lab estimates about half of the new tariff revenue comes from IEEPA tariffs.

Tariff-Mitigating-Strategies

Legality of Tariffs

The Supreme Court heard oral arguments in early November after the administration appealed decisions made by lower courts that found the tariffs illegal in cases brought by toymaker Learning Resources and wine importer V.O.S. Selections that challenged the president’s use of IEEPA to justify the tariffs.

Supreme Court sets Friday as an opinion day, raising anticipation of a tariff ruling.

Electronic Refunds
Beginning February 6, 2026, U.S. Customs and Border Protection (CBP) will issue all refunds electronically via Automated Clearing House (ACH) (subject to limited exceptions).

08

Compliance/Regulatory​
Market Overview

The U.S. and global regulatory landscape continues to evolve at a rapid pace. According to data from one of Taylor’s affiliated testing laboratories, approximately 4,500 new regulations have been proposed or enacted as of the end of Q3 2025, a record-setting figure.

This represents an increase of roughly 1,500 regulations compared to the volume seen three-to-four years ago.  

Taylor’s compliance team remains vigilant in tracking and assessing regulations relevant to our business. In response to the growing volume and complexity of regulatory changes, the compliance team is implementing strategic adjustments, which are outlined below.

These enhancements are designed to ensure Taylor remains agile and well-informed in an increasingly dynamic regulatory environment.

Taylor Compliance - Program Enhancements

 
We are streamlining our compliance program to better serve our internal and external customers. By using centralized technologies and controlled processes, we ensure products meet all requirements. Our efforts focus on three key areas.

Centralized Compliance Request Tracking

Utilize Monday.com to manage compliance requests, offering real-time visibility into each case. The tracker monitors regulatory status, supplier response performance and overall trends in incoming compliance requests.   

Supplier Compliance Management

Utilize a survey tool to collect required regulatory compliance statements for finished products and raw materials from suppliers to improve visibility and support  strategic planning for future production of compliant materials.

Centralized Compliance Resource Library

Maintain a single source SharePoint-based platform library with self-service access aims to improve the delivery of global regulatory and compliance information for both internal and external customers.

State of Washington Safer Products for Washington - Bisphenols

The State of Washington has a law titled Safer Products for Washington (SPWA), which is intended to restrict toxic chemicals in consumer products and increase transparency. This regulation contemplates some product categories applicable to Taylor's business, including thermal paper.

Bisphenols, including BPA, BPS and others, are known to be found in thermal papers. The bisphenol chemicals function to cause the printing to be visible on the paper as it is run through a thermal printer.  The full list of product categories, chemicals, restrictions and restriction effective dates can be found here. The effective date for phenols in thermal papers is January 1, 2026.

If you have specific questions about SPWA, bisphenols in thermal paper subject to SPWA and related topics, please contact Emily Rudie at emily.rudie@taylor.com.

State of Washington Safer Products Restrictions and Reporting - PFAS Requirements

On November 20, 2025, the Washington State Department of Ecology amended regulation, Chapter 173-337 WAC, which prohibits intentionally added perfluoroalkyl and polyfluoroalkyl (PFAS) and mandates reporting requirements. The amendment adds 12 additional product categories.  

While Taylor does not manufacture and/or sell products that fall into many of the product categories, some Taylor business units, primarily Taylor DM Brands, Inc. (Promo), manufacture and sell products that fall into some of the categories.  

The list of all product categories, restrictions and reporting requirements, and key dates can be reviewed here.

EPA: PFAS Reporting Rule Update

On November 10, 2025, the EPA proposed significant changes to the 2023 PFAS reporting rule.  A summary of the proposed changes is as follows:​

  • Exempting imported articles.
  • Exempting de minimis quantities.​
  • Changes to the type and amount of data currently required to be submitted.

Should the proposal be finalized, it is also possible it would result in the delay of the start of the reporting period, which is currently set to start April 13, 2026.

Taylor's compliance team will continue to monitor this proposal and provide updates as necessary.

DBDPE Added to Candidate List

REACH: On November 5, 2025, an additional chemical (DBDPE) was added to The Candidate List of substances of very high concern (SVHC) bringing to total  number of chemicals on the list to 251. Below is information on the newly added chemical.

Substance Name EC Number CAS Number Reason for Inclusion Examples of Uses
1,1’-(ethane-1,2-diyl)bis[pentabromobenzene](DBDPE) 284-366-9 84852-53-9 Very persistent and very bioaccumulative, vPvB (Article 57e) Flame retardant